Scatter Plot View
A scatter plot graph demonstrates the relationship between the data values of two or more variables. A scatter plot graph can be created quickly by selecting two or more @RISK elements (inputs or outputs) and then selecting the Scatter Plot option from the Explore Menu. If no elements are selected, or only a single element is highlighted, @RISK will prompt for the appropriate selection.
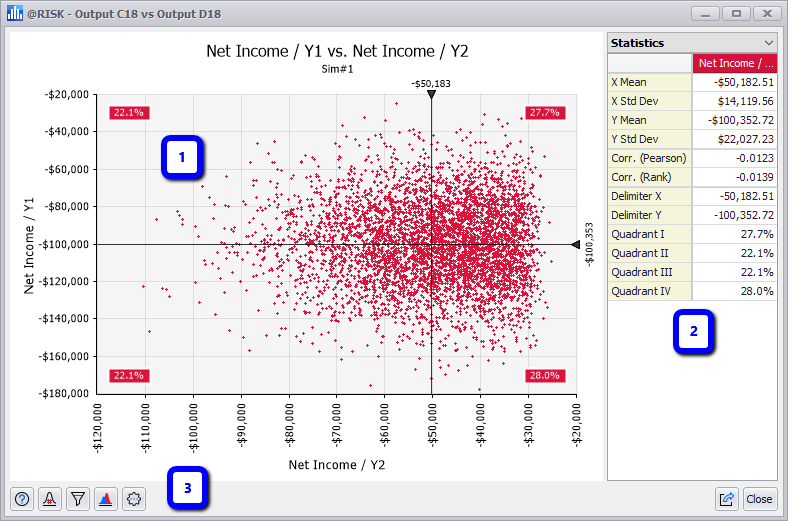
Figure 1 - Browse Results Scatter Plot Graph
Browse Results Scatter Plot
The Scatter Plot window consists of the following primary components:
- Graph Panel
- Information Panel
- Command Buttons (see below)
Scatter Plots and Multiple Simulations
When a simulation is run utilizing multiple simulations, each simulation's results can be displayed in the Scatter Plot window separately, or all simulation results can be combined into a single view.
To switch between simulations, or to toggle 'All Simulations', use the Select Simulation # to Display button (  ) in the command buttons. See Scatter Plot Command Buttons, below, for more information.
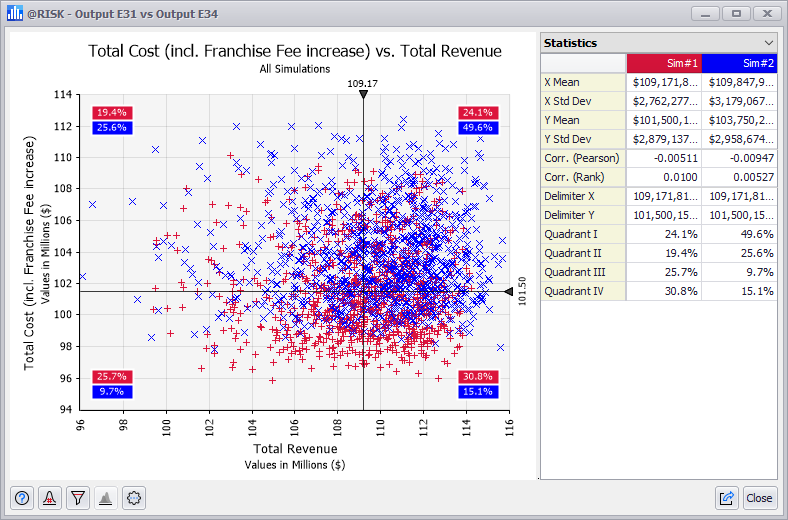
Figure 2 - Scatter Plot - Multiple Simulations
By default, the Scatter Plot window will indicate the simulation being viewed in a few ways:
- The graph title will display the simulation number, or 'All Simulations' when viewing all simulation results
- The graph will display each simulation as its own data set, color coded per Graphing Options. This includes the delimiter bar at the top of the graph.
- The information panel will display the selected data (e.g. legend or statistics) for each simulation, color coded to match the graph.
Scatter Plot Command Buttons
The Scatter Plot window includes the following Command Buttons:
-
 Help - Open help resources (online or local, based on @RISK settings); see Help Button for more information.
 -
Select Simulation # to Display - Only active when browsing simulation results that include multiple simulations. Switch between simulations, or select 'All Simulations' to view combined results overlaid each other.
-
 Define Filters - Define filters for the elements being viewed. See Filtering Results.
 -
 Overlays - Add or remove an overlay to the current distribution graph; see Overlay Manager for more information.
 -
 Settings/Actions - Window-specific setting options and commands. The Define Distribution Settings/Actions are:
-
 Export - Commands for exporting the current graph and legend; see Export Button for more information.