Graphing Options
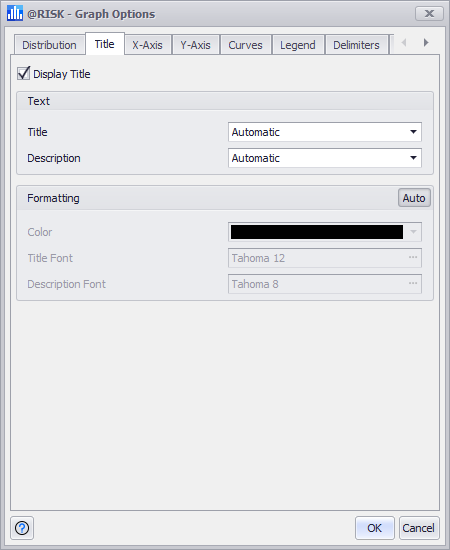
Figure 1 - Graph Options - Title Tab
The most comprehensive way to format a graph is by using the Graph Options dialog, which allows for customizations of graph colors, fonts, axis scaling, displayed statistics, and many other options. This window is accessible from the Settings/Action button of any window that displays a graph. It can also be accessed quickly from any graph’s right-click menu.
The Graph Options window contains a large number of tabs, each with a large number of options. Certain tabs will be displayed for every type of graph, while others are shown or modified depending on the details of what the graph contains.
These tabs are common to most graphs:
These tabs apply only to particular types of graphs:
- Distribution Tab (Distribution Graphs)
- Delimiters Tab (Distribution Graphs)
- Markers Tab (Distribution Graphs)
- Scatter Tab (Scatter Graphs)
- Delimiters Tab (Scatter Graphs)
- Box-Whisker Tab (Summary Boxplot Graphs)
- Trend Tab (Summary Trend Graphs)
Automatic Options

Figure 2 - Auto Toggle
Many of the options groups in the Graph Options dialogs include an 'Auto' option (Figure 2, left). The 'Auto' option is toggled by default; to modify the options set automatically, untoggle the option and the other options within the panel will be editable.