Graphing in @RISK
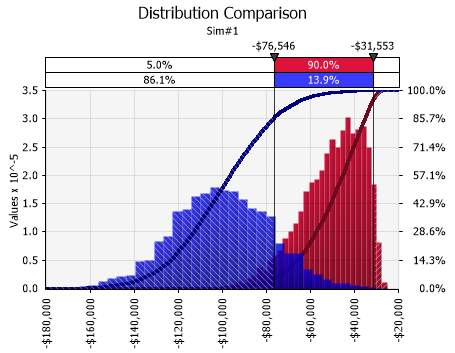
Figure 1 - An @RISK Graph
@RISK features a range of graph options that include all of the most common graphs utilized in risk analysis. And while there are many different types of Excel graphs, @RISK uses its own graphing engine for generating visualizations for the different components of a model. Additionally, the @RISK graphing engine has capabilities that are not possible in the native Excel charts (e.g. overlays using separate binning).
Each @RISK window that displays a graph will often have unique characteristics related to the particular graph being displayed; however, there is a larger collection of common graph operations which apply to nearly all graphs. This section details both the common features and functions of graphing in @RISK, as well as the specific details on using certain graphs in specific windows. This section consists of the following primary topics: