Exporting Graphs

Most @RISK graphs can be exported to files, the clipboard, or to native Excel charts. To access graph exporting options, either click the Export button which will be in the bottom right corner of the window containing the graph, or right-click on the graph itself.

The export options available in the right-click menu of the Graph Panel are the same options available in the Export button ( ) in the command button area of numerous @RISK windows.

The exporting options include:

  • Copy Graph - Copy the graph to the clipboard; it can then be pasted either to the Excel workbook or another document.
  • If this option is selected and the Information Panel is set to show the Statistics Grid, the image that is created will not include the Statistics; it will only include the Legend. To include the Statistics, use the 'Copy Graph and Grid' option. For all other legend settings (Legend, Legend (with Statistics), and None) the graph will be copied exactly as configured.

  • Copy Graph and Grid - Copy both the graph and the full Statistics Grid. A single image will be created that can be pasted to another location.
  • This option takes a screenshot of the Graph and Information panels so that they can be pasted to another location; if the Statistics Grid is not sized to show all statistics (the scrollbar shows on the right side), the pasted image will only include the statistics that are visible at the time the graph is copied.

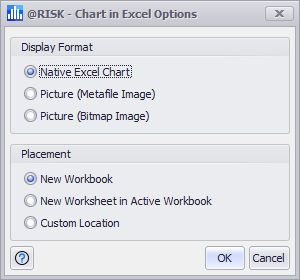
Figure 1 - Chart in Excel Options

  • Print Graph - Copy the graph image and open the Print dialog for direct printing.
  • Save Image File - Copy the graph and open a Save File dialog to save the graph as a Bitmap (.bmp), a JPEG file (.jpg), a PNG file (.png), or an Enhanced Metafile (.emf).
  • Chart in Excel - Copy the graph and insert it directly into Excel as a Chart; this opens the Chart in Excel Options dialog box (Figure 1, right).

To insert an @RISK chart into Excel, select from the following options: 

  • Display Format - Select if the graph is added as a metafile image, a bitmap image, or a native Excel chart object.
  • Placement - Select where the chart will be inserted - into a new workbook, a new worksheet in the active workbook, or in a custom location that is specified after the dialog is closed.