Types of Graphs
In this section, the different types of graphs that can be made in @RISK are covered, along with some of the characteristics that distinguish them from other graphs.
The types of graphs available in @RISK are:
Distribution Graphs
A distribution graph shows the range of possible outcomes and their relative likelihood of occurrence.

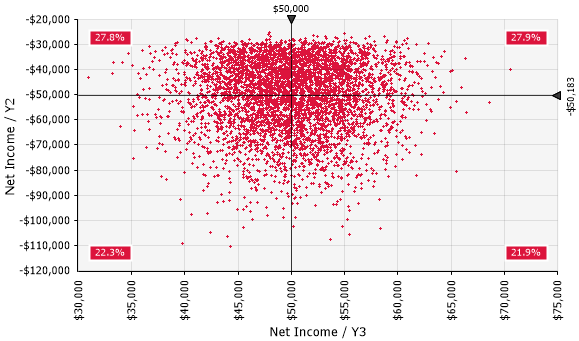
Scatter Plot Graphs
A scatter plot shows the relationship between the data values of two variables along two axes, potentially revealing any correlation between the two.
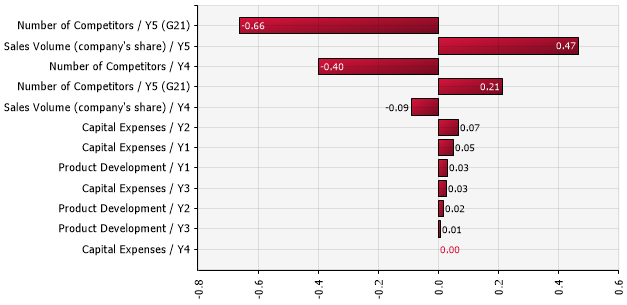
Tornado Graphs
Tornado graphs visualize either sensitivity analysis or scenario analyses, both of which are different ways of analyzing how the inputs in a model drive the behavior of the outputs.
Spider Graphs
A spider graph shows how the value of an output statistic changes as the sampled input value changes.

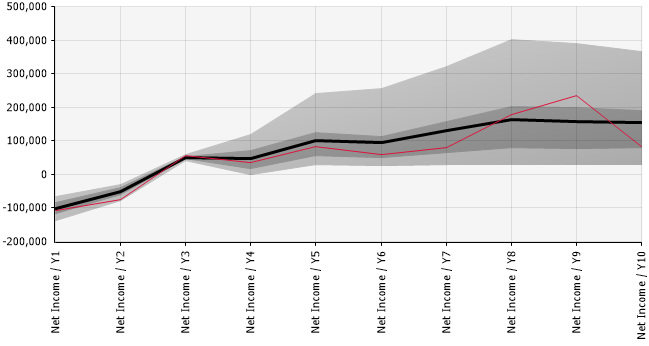
Summary Trend Graphs
A Summary Trend graph summarizes changes across multiple probability distributions.
Summary Boxplot Graphs
A Summary Box Plot summarizes changes across multiple probability distributions.
