Results Summary Command Buttons
The Command Buttons for Browse Results window include:
-
 Help - Open help resources (online or local, based on @RISK settings); see Help Button for more information.
 -
 Select Simulation # to Display - Only active when viewing simulation results that include multiple simulations. Switch between simulations, or select 'All Simulations' to view combined results.
 -
 Define Filters - Define a single filter for the element currently selected in the list. See Defining Filters.
 -
 Settings/Actions - Window-specific setting options and commands. The Define Distribution Settings/Actions are:
-
- Table Settings - Opens the Table Settings dialog; more information on configuring tables can be found in Table Settings.
- Default Categories (Input Tab Only) - Specifies how @RISK automatically determines category names; see Automatic Names for more information.
- Group Rows By - When viewing the elements for multiple workbooks, multiple worksheets, or when inputs have been assigned categories, turn grouping on or off.
-
The 'Group Rows By' settings is a shortcut to changing the Table Settings configuration for each of the fields listed below. Checking the option will change the field setting to 'Grouped', while unchecking the option will change the field setting to 'Fixed'.
- Collapse - Collapse the Results Summary. All containers will be collapsed to hide their contents.
- Expand - Expand the Results Summary. All containers will be expanded to show their contents.
- Reset Graph to Defaults - Remove all formatting options and reset the graph display to the @RISK defaults.
- Find - Open the Find panel (Figure 1, below) at the top of the active tab.
-
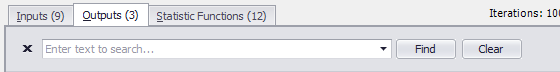
Figure 1 - Results Summary - Find Panel
-
 Explore - The Explore command button includes the same graphing options available through the Explore Menu; some options - 'Scatter Plot', 'Summary Box Plot', and 'Summary Trend' will only be available if multiple elements are selected in the Results window. Selecting an option will open a new Browse window displaying the chosen graph for an element or elements highlighted in the window. See Simulation Graphs for more information on the graphs available.
 -
Only five (5) elements can be opened simultaneously through the Explore menu; if more than five elements are selected, only the first five will be opened in new Browse Results windows!