Model Definition

The Model Definition window (Figure 1, below) provides an interface for defining a RISKOptimizer model, including its objectives, adjustable cells, and constraints.

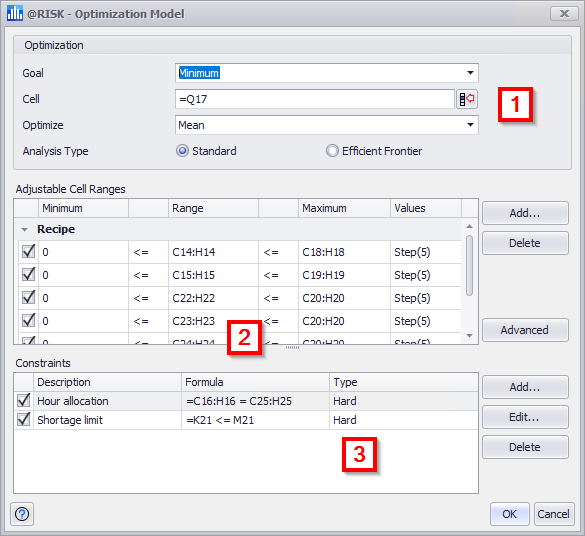
Figure 1 - RISKOptimizer - Model Window

RISKOptimizer Model Window

The RISKOptimizer Model window consists of the following primary components:

  1. Optimization Configuration
  2. Adjustable Cell Ranges
  3. Constraints

Optimization Configuration

The top section of the window includes three options that specify the optimization’s objective. These configurations are: 

  • Optimization Goal - Specifies the type of optimization to perform.
  • Typically, the Optimization Goal will be set to 'Maximum' or 'Minimum', indicating that the objective is to obtain the largest possible or smallest possible value, respectively. It can also be set to 'Target Value' which causes RISKOptimizer to attempt to match a selected value as closely as possible.

  • Cell - Specifies the target cell to be optimized. This cell should contain a formula that depends - either directly or through a series of calculations - on the adjustable cells.
  • Optimize – What statistical measure of the target cell is to be optimized: mean, standard deviation, etc.
  • Although not as common, it is also possible to optimize the Value of a cell, not one of its simulation statistics. For example, when engineering a complex system, money can be spent on backup systems, thereby reducing the probability of failure. The adjustable cells would specify the number of different backup systems. The cell formula calculating the cost of the backup systems depends on the values of the adjustable cells, but it contains no uncertainty. In this case, it would be best to minimize the cost cell using the 'Value' option in the dropdown list.

    Another situation where it would be advisable to choose the 'Value' option is when the target cell involves @RISK statistics functions for a goal. This method is especially useful when it is necessary to optimize a statistic not included in the dropdown list. For example, an investor might want to maximize the Sharpe ratio of a portfolio of securities, defined in terms of the mean and standard deviation of the portfolio returns. If the portfolio return (the uncertain quantity) is in cell F10 and the riskfree rate of return is in cell F3, an appropriate formula for the Sharpe ratio is:

    =(RiskMean(F10) – F3) / RiskStdDev(F10)

    If this formula is in cell F12, then the 'Value' option for cell F12 should be selected in the Optimize dropdown list as the goal of the optimization.

  • To optimize a percentile or a target, set the field to Percentile (X for given P) or Target (P for given X). In both cases an extra field will appear to enter the desired value.

  • Analysis Type – Specifies what type of analysis to perform.
    • Standard – Performs a standard optimization.
    • Efficient Frontier – Performs multiple optimizations, using a number of different constraining values. See Efficient Frontier Analysis for more information.