Efficient Frontier Analysis
Efficient frontier analysis is a special kind of optimization. It is used when there are two competing goals. One of them is chosen as the target for an optimization, while the other is constrained to be no worse than a specified limit. Then a sequence of optimizations is performed, each time changing the limit value for the constraint.
Although efficient frontier analysis is most commonly used for financial portfolio optimization, it can be applied to a variety of problems where there are two competing goals. Determining a waste management system that minimizes cost and minimizes the pollution level would be one example. Because these goals are pulling in opposite directions, the optimization model might be configure to minimize cost while putting various upper limits on the allowable pollution level. Alternatively, the same model could be reconfigured to minimize the pollution level, while putting various upper limits on the allowable cost.
For illustration, however, this discussion will be in usual context of portfolio optimization. In this context, the goal is to find a portfolio of securities that maximizes expected portfolio return and minimizes risk, usually measured by the standard deviation of portfolio return. As in the pollution example, these two goals pull in opposite directions, so efficient frontier analysis typically minimizes the risk (standard deviation), while putting a lower bound on the expected return. (It could be performed in the opposite way, by maximizing expected return with an upper bound on risk.) By performing several optimizations, each with a different lower bound on the expected return, the efficient frontier is mapped out. It indicates, for any given required expected return, the portfolio that minimizes the risk. Then from all the portfolios on the efficient frontier, one can choose a preferred portfolio given the risk preferences.
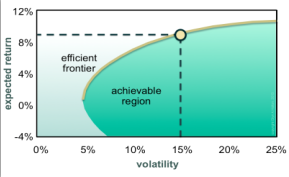
Figure 1 - Efficient Frontier
The graph at right (Figure 1) illustrates an efficient frontier, the yellow curve. Optimal portfolios can be found for any point on this curve, and these are the only portfolios an investor should consider. Points in the darker green area below and to the right of the efficient frontier correspond to portfolios that have more risk than necessary for any specified expected return, so they are suboptimal and shouldn’t be considered. Points in the lighter green area above and to the left of the efficient frontier are impossible to achieve.
RISKOptimizer can perform efficient portfolio analysis for any model with two competing goals. In the Model Definition dialog, choose one of the goals as the target to optimize and specify that you are performing an efficient frontier analysis. Then add an “efficient frontier” type of constraint on the other goal, indicating the range of constraining values to explore. RISKOptimizer will then perform a sequence of optimizations, one for each bound you specify, and then present the results in graphical and tabular form.
This procedure takes longer because RISKOptimizer is solving several optimizations, but it doesn’t take as long as might be expected. RISKOptimizer uses a very efficient method of simultaneously solving all of the optimizations in “one pass.”