Summary Letter Value Graphs
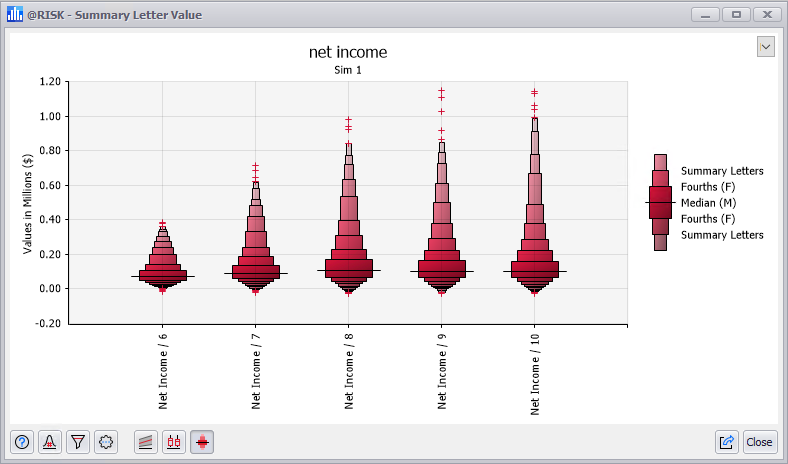
Figure 1 - Summary Letter Value Graph
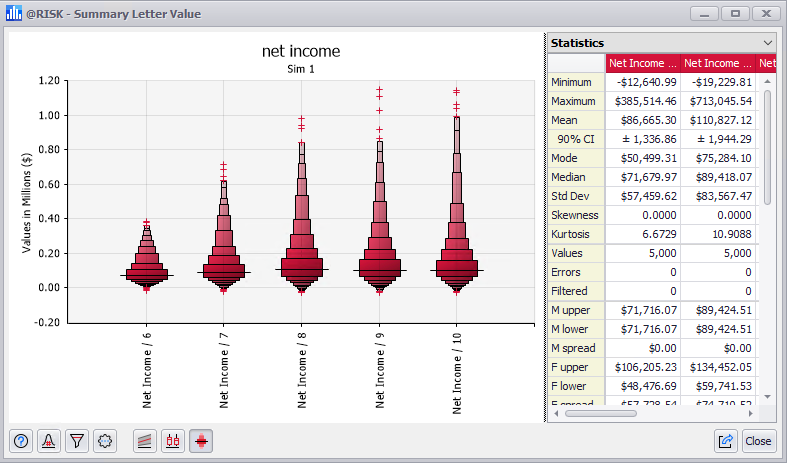
Figure 2 - Summary Letter Value with Statistics Grid
A Summary Letter Value Graph (Figure 1, right) is an advanced version of the Summary Boxplot; it uses a similar approach to graphing the spread of values, but uses more than the boxplot's five number summary (minimum, first quartile, mean/mode/median, third quartile, and maximum). Letter Value Graphs of simulation results can be created from the Explore Menu or Results Summary window.
The Letter Value graph starts by ordering all values from highest to lowest, and then finds the median. Using the median, the process then finds the "fourths" (F), or the middle of the two batches of values on each side of the median, and plots the depth of the fourths in terms of the number of values each batch contains. The process continues with each batch outside the fourths to find the "eighths" (E), and so on through sixteenths (D) to any depth required until it reaches values that only occur once (a depth of 1). When used to graph multiple probability distributions the graph visualizes change across the set of distributions.
Additionally, the graph can be configured to display outlier data points as demonstrated by the red plus ("+") symbols in Figure 1. Outliers are the data points that exist at the upper and lower ends of the spread, generally at the 1st and 99th percentile.
Please Note: when using a Letter Value graph on simulations of less than 50 iterations, the threshold for outliers is greater (generally at the 5th and 95th percentile).
Select Legend View
The Summary Value Letter Graph window includes options for changing the graph legend using the pulldown menu in the upper right corner of the window, including a legend (Figure 1, right) and a Statistics Grid (Figure 2, right). The options available are:
Letter Value Graphs Across Multiple Simulations
If displaying a graph across multiple simulations, multiple copies of the Letter Value graph are shown side-by-side (Figure 3, below).
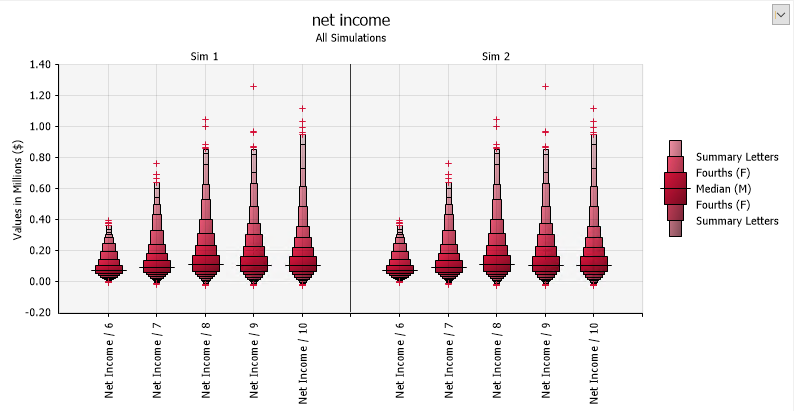
Figure 3 - Summary Letter Value Graph - Multiple Simulations