Single Variable Data Viewer
Using the Data Viewer on a single variable, or dragging and dropping a single variable from the Multivariate Data Viewer window, displays a simple graph window for a single variable (Figure 1, below). This window shows the distribution of the variable’s data, and the same options for manipulating the graph’s display as other @RISK graph windows.
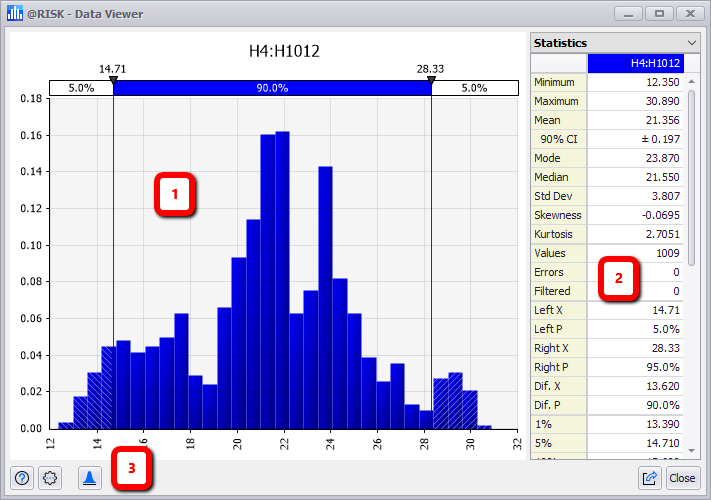
Figure 1 - Data Viewer - Single Variable
Data Viewer - Single Variable
The Single Variable view of the Data Viewer contains the following primary components:
- Distribution Graph
- Information Panel
- Command Buttons (see below)
Command Buttons
The Single Variable Data Viewer window contains different command buttons than the Multivariate Data Viewer. The commands available are:
-
 Help - Open help resources (online or local, based on @RISK settings); see Help Button for more information.
 -
 Settings/Actions - Window-specific setting options and commands:
-
 Distribution Display Format - Options for quickly changing the display format of the distribution graph. See Display Format for more information.
-
 Export - Commands for exporting the current graph and legend; see Export Button for more information.