Multivariate Data Viewer
The Multivariate Data Viewer window (Figure 1, below) provides a quick way to look at multivariate data sets, including a graph and statistics on each of the data sets included. This window has five different views, each giving a different perspective on the data. The view buttons at the bottom of the window indicate and control which of the views is active.
The specific commands available in the Settings/Actions and Export buttons depend on which of the views is currently active. Refer to each section below for details on the commands available in that view.
One of the most useful functions of the Data Viewer window is the ability to open detailed views of nearly any element in the current display. For example, the graph and statistics for a single data set can be opened in a Single Variable Viewer window from the Multivariate Data Viewer. This technique applies to the Summary View and Correlation View only.
To view a specific element in its own window, drag the element (e.g. a row from the Summary View, pictured below) from the Multivariate Data Viewer window and drop it outside the window. A new Data Viewer window will open.
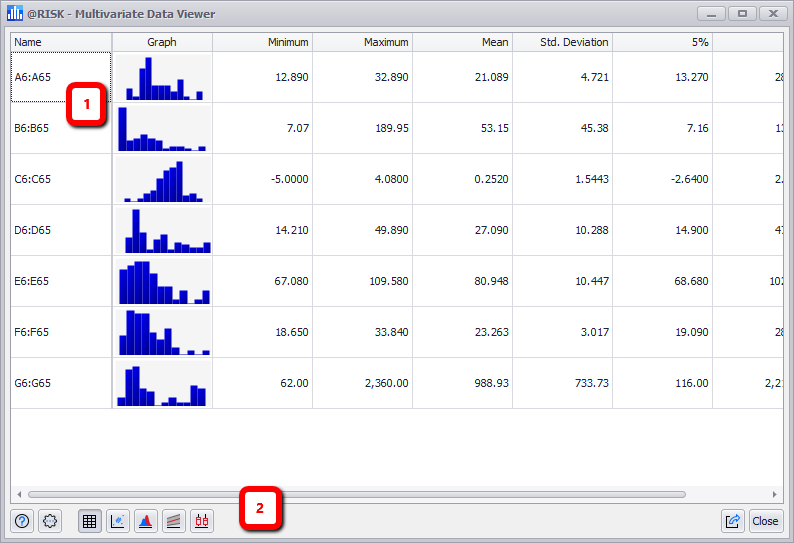
Figure 1 - Mutlivariate Data Viewer - Summary View
Multivariate Data Viewer Window - Summary View
The Multivariate Data Viewer window components will change based on which view is active. The Summary View, pictured here, contains the following primary components:
- Summary Table
- Command Buttons
Summary View
The Summary View (Figure 1, above) gives a quick overview of the data set in tabular format. Each row of the table corresponds to one variable in the data set and shows the variable name, a thumbnail graph, and several statistical summary measures.
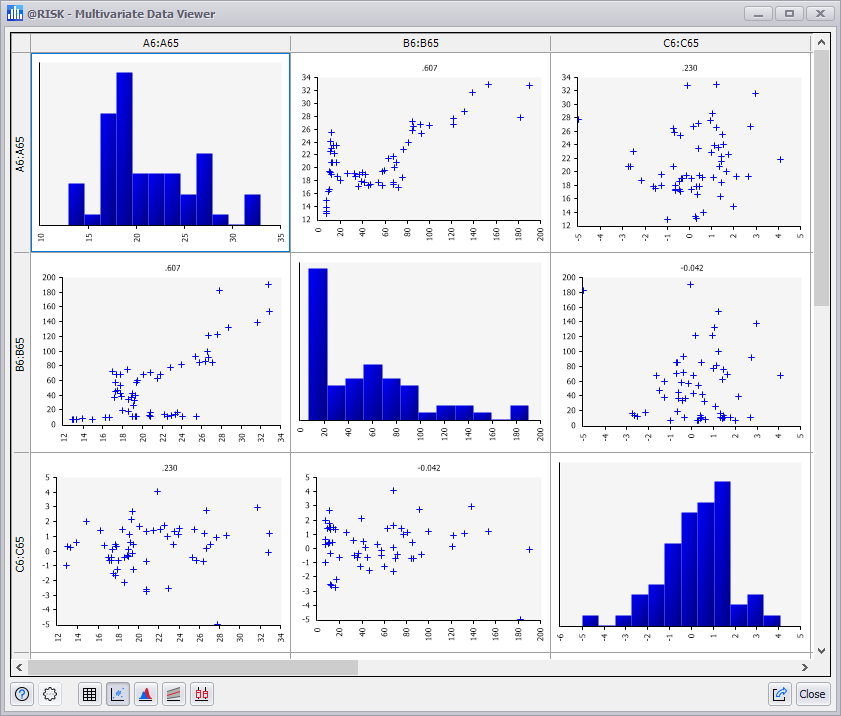
Figure 2 - Multivariate Data Viewer - Correlation View
Correlation View
The Correlation View (Figure 2, right) displays graphical and numeric information about the correlation patterns between variables in the data set. It displays histograms of individual variables on the diagonal and scatter plots for pairs of variables off the diagonal. The correlation coefficients associated with each pair are shown at the top of each scatter plot.
Overlay View
The Overlay View (Figure 3, below) shows variables simultaneously in a single graph, with the Information Panel including statistics in the right panel. To prevent graphs from being too cluttered, by default a maximum of three variables will be overlaid.
Multivariate Data Viewer - Overlay View
The Overlay view contains the following primary components:
- Graphing Panel
- Information Panel - this panel can display a legend, the statistics, or a data view using the pulldown menu at the top of the panel.
- Command Buttons
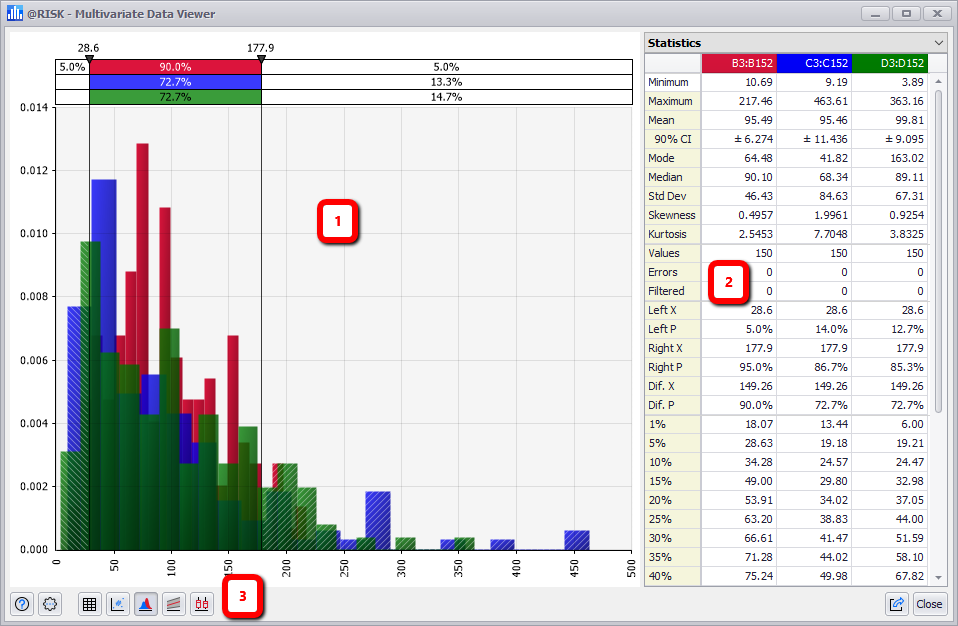
Figure 3 - Multivariate Data Viewer - Overlay View
The Data Viewer will only display variables with the same formatting as the first variable in the data set. For example, if the data contains some numeric values, some date values, and some percentage values, and the first variable contains only numbers, @RISK will only show the other variables that contain only numbers. The Select Variables to Graph command on the Settings/Actions menu allows these defaults to be overridden.
Trend View and Boxplot View
The Trend View and Boxplot View (Figures 4 and 5, below) show summary statistics of all the variables in a compact graphical format. The Data Viewer will only display variables with the same formatting as the first variable in the data set. For example, if the data contains some numeric values, some date values, and some percentage values, and the first variable contains only numbers, @RISK will try to only show the other variables that contain only numbers. The Select Variables to Graph command on the Settings/Actions menu allows these defaults to be overridden.
The maximum number of variables that can be displayed is 500.
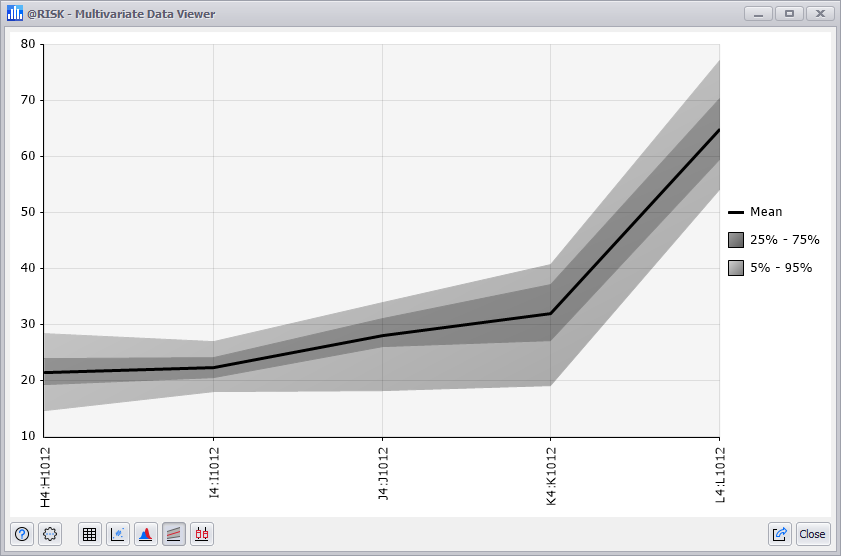
Figure 4 - Mutlivariate Data Viewer - Trend View
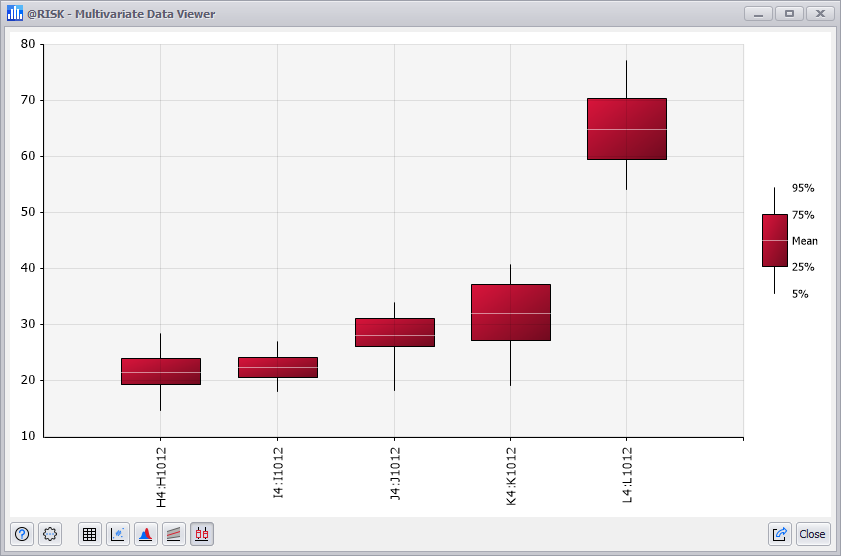
Figure 5 - Mutlivariate Data Viewer - Boxplot View