Data Viewer

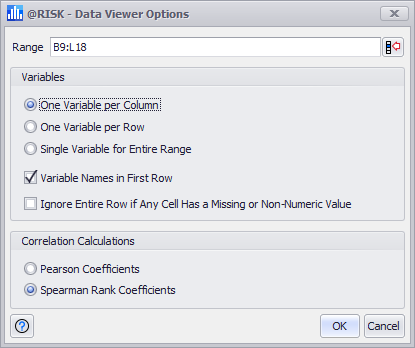
Figure 1 - Data Viewer Options Window

To use the Data Viewer, select a range of data and click the top half of the Data button in the @RISK ribbon; alternately expand the Data menu and select 'Data Viewer'. The Data Viewer Options window (Figure 1, right) will open and the properties of the data set can be specified.

The Data Viewer can be used to analyze numeric or date data. It can not analyze text!

When selecting a set of data to analyze, selecting a single cell within the data set and @RISK will automatically expand the selection to include the full data set range (e.g. column and/or row).

Data Viewer Options

The Data Viewer Options must be configured before the Data Viewer can open to display analysis of the selected data set. The Data Viewer Options window (Figure 1, above) includes three primary option groups:

  • Range - The range where the data set is located. @RISK may adjust this range based on the current selection, but it can be changed as necessary.
  • Variables Group - Configure how @RISK recognizes data sets for individual variables.
    • Variable Arrangement - The radio buttons configure the arrangement of variables - in rows, in columns, or the data can be a block of values that should be treated as a single variable.
    • Variable Names in First Row/Column - If the first row or column contains the names of the variables in the data set, check this option. @RISK will try to detect this automatically, but it can be set manually if necessary.
    • Ignore Entire Row/Column if Any Cell Has a Missing or Non-Numeric Value - Checking this option will discard an entire row or column if any of the values in that row or column are missing or non-numeric. If this option is not checked, missing or non-numeric values will still be ignored, but will not affect entire rows or columns.
  • Correlation Calculations Group - The Data Viewer automatically displays correlation coefficients between the variables. This option controls how these coefficients are calculated. The options are either Pearson Coefficients or Spearman Rank Coefficients.

Once the options have been configured, click OK.

One of two windows will be displayed. If there is more than one variable in the selected data set, the Multivariate Viewer window will appear.

If there is only a single variable, a Single Variable Viewer window will open.