Summary Graphs
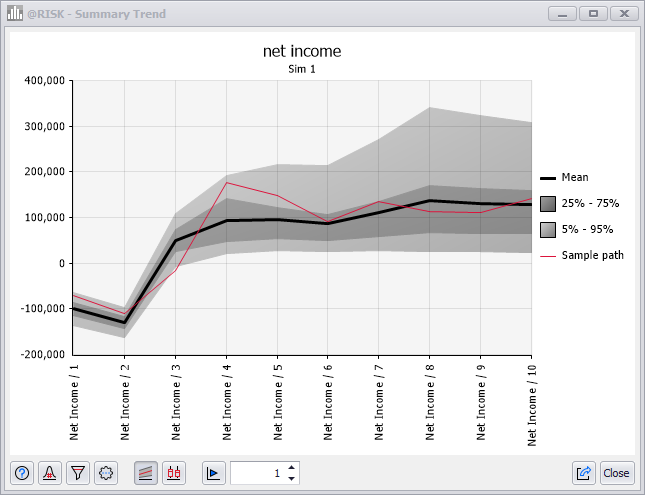
Figure 1 - Summary View - Summary Trend Graph
The Summary Views (Figure 1, right) includes two graphing options available within the same window - the summary trend graph and the summary box plot graph, both of which summarize changes across multiple probability distributions. Figure one demonstrates the Summary view with a summary trend graph. Either graph can be created quickly by selecting two or more @RISK elements (inputs or outputs) and then selecting either the Summary Box Plot or the Summary Trend option from the Explore Menu. If no elements are selected, or only a single element is highlighted, @RISK will prompt for the appropriate selection.
Summary View Command Buttons
The Summary View window includes the following Command Buttons:
-
 Help - Open help resources (online or local, based on @RISK settings); see Help Button for more information.
 -
 Select Simulation # to Display - Only active when browsing simulation results that include multiple simulations. Switch between simulations, or select 'All Simulations' to view combined results overlaid each other.
 -
 Define Filters - Define filters for the elements being viewed. See Filtering Results.
 -
 Settings/Actions - Window-specific setting options and commands. The Summary Graph Settings/Actions are:
-
 Export - Commands for exporting the current graph and legend; see Export Button for more information.
Additionally, there are two buttons to toggle the graph display between Summary Trend and Summary Box Plot views. The options are:
-
 Summary Trend View - Switch the graph displayed to a summary trend graph.
 -
 Summary Box Plot View - Switch the graph displayed to a summary box plot graph.
 -
 Animate Sample Path - Only available when Summary Trend View is selected. Animate the graph by switching iterations once every second.
 - Select Iteration - Only available when Summary Trend View is selected. Manually select an iteration to be displayed by using the arrows, or by entering a value.