Simulation Scenarios
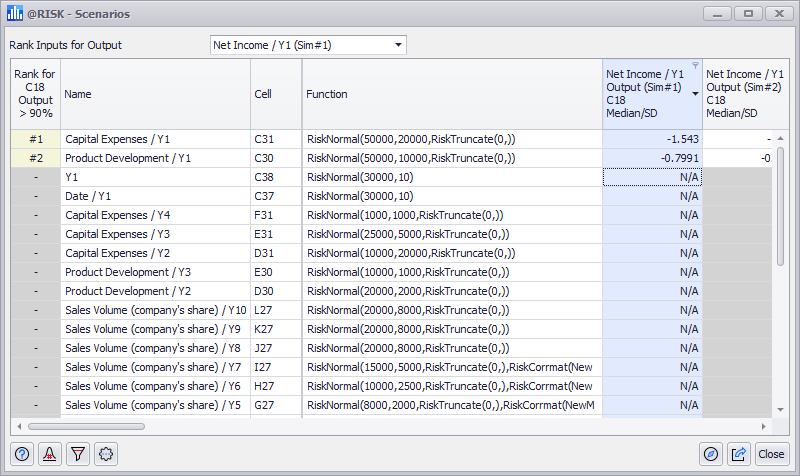
Figure 1 - Scenarios Window
The Scenario command in the Explore Menu opens the Scenario window (Figure 1, right) which displays scenario analysis results for outputs in an @RISK model. Scenario analysis helps in identifying which input variables contribute significantly towards reaching a specific outcome for the selected output; the Scenarios window shows a ranked list of the inputs that had a measurable effect on the output given the scenario selected in the Settings/Actions menu.
To view the scenario analysis for an output, select the output from the top pull-down menu.
To switch between scenarios, use the Settings/Actions menu to select which scenario is displayed.
For simulation runs that include multiple simulations, each output will be listed for each of the simulations, with the simulation name appended to the output name in the pull-down menu (e.g. 'Net Income / Y1 (Sim #1)').
@RISK allows for three scenarios to be defined. These scenarios can be modified using the Scenario Settings command from the Settings/Actions menu (see below).
Scenarios Command Buttons
The Scenarios window includes all of the standard command buttons detailed in Simulation Details. The Settings/Actions button includes the following commands:
-
 Settings/Actions - Window-specific setting options and commands. The Scenarios window Settings/Actions are:
-
- Scenario 1, 2, & 3 - The first three options of the menu correspond to the three defined scenarios. Select the scenario to be displayed in the window.
- Show Scatter Plot Matrix - Show a scatter plot matrix in addition to the values for each input. See below for more information.
- Scenario Settings - Opens the Sensitivity Settings window to configure the selected ranking method. See below for more information.
- Find - Open the Find panel (Figure 2, below) at the top of the window.
-
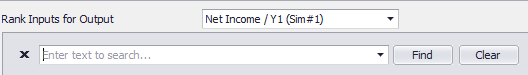
Figure 2 - Scenario Find Panel
Scenario Settings
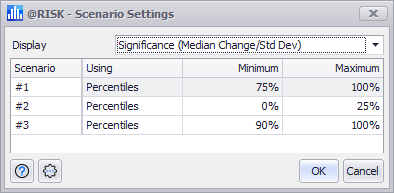
Figure 3 - Scenario Settings Window
The scenarios @RISK is configured to use can be modified in the Scenario Settings window (Figure 3, right). The Scenario Settings window has two primary configuration:
Scenario Scatter Plots
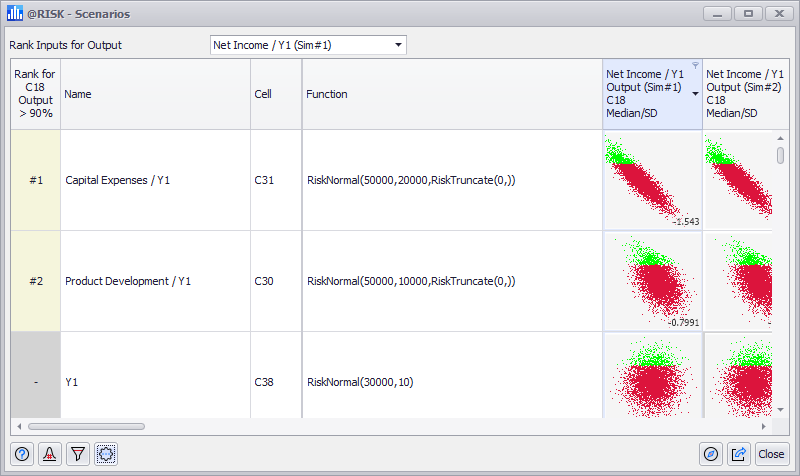
Figure 4 - Scenarios Scatter Plots
Toggling the Show Scatter Plot Matrix option of the Settings/Actions menu will display the scatter plots for each input within the scenario analysis results (Figure 4, right). The values for each cell will still be displayed in the lower right corner.
The colors of the scatter plot are determined by the settings in Scatter tab of the Graphing Preferences.