Define Distribution

Figure 1 - Add Distribution
One of the first steps to risk analysis is to build a model; the model will include one or more inputs, which can be simple values for known quantities, or probability distributions which represent values with some degree of uncertainty. The Define Distribution window will enter a formula into the selected cell using the @RISK function that corresponds to the selected distribution.
When editing an existing distribution, or after selecting a new distribution for a cell, the Define Distribution window (Figure 2, below) will be displayed. The Define Distribution window graphically displays probability distributions that can be substituted for values in the formula in the currently selected cell. By modifying the selected distribution, the range of possible values for an uncertain input in a model can be described.
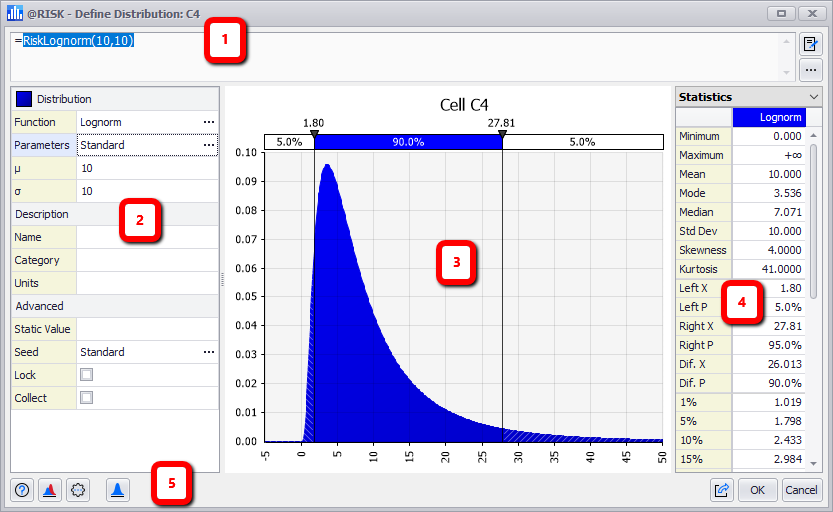
Figure 2 - Define Distribution Window
Define Distribution Window
The Define Distribution Window consist of the following primary sections:
- Formula Bar
- Configuration Panel
- Graph Panel
- Information Panel
- Command Buttons
Distribution Graph and Information Panel
The graphing area of the Define Distribution window consists of two panels - the Graph Panel and the Information Panel (items 3 and 4 in Figure 2, above). The Graph Panel is a visual representation of the selected distribution and its current settings. The Information Panel is the legend for the graph, and can be configured to show differing levels of information about the graph.
The Graph and Information Panels are used throughout @RISK, and are covered in more detail starting in Graphing in @RISK.