Browse Results Command Buttons
The Command Buttons for Browse Results window include:
-
 Help - Open help resources (online or local, based on @RISK settings); see Help Button for more information.
 -
 Select Simulation # to Display - Only active when browsing simulation results that include multiple simulations. Switch between simulations, or select 'All Simulations' to view combined results overlaid each other.
 -
 Define Filters - Define a single filter for the element being viewed. See Filtering Results.
 -
 Overlays - Add or remove an overlay to the current distribution graph; see Overlay Manager for more information.
 -
 Settings/Actions - Window-specific setting options and commands. The Define Distribution Settings/Actions are:
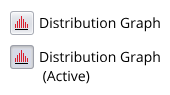
Figure 1 - Active vs. Inactive State
Additionally, there are several buttons to toggle and configure the graph display and for toggling Browse Mode. When a view (or mode) is active, its button will change to indicate this state (Figure 1, right). The options are:
-
 Distribution View - Switch the graph displayed to a distribution graph, and configure the display format of the graph. See Simulation Graphs for more information.
 -
 Sensitivity View - Switch the graph displayed to a tornado graph, and configure the display format of the graph. See Simulation Graphs for more information.
 -
 Scenario View - Switch the graph displayed to a scenario graph, and configure the display format of the graph. See Simulation Graphs for more information.
 -
 Toggle Browse Mode - Toggle Browse Mode on or off.
 -
 Export - Commands for exporting the current graph and legend, or simulation data; see Exporting Graphs for more information.