Sensitivity Analysis Settings

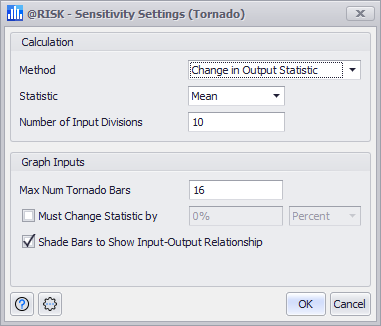
Figure 1 - Sensitivity Settings Window (Tornado Graph)
Every window, graph, or report that displays sensitivity information has a button to display the Sensitivity Analysis Settings window (Figure 1, right). This dialog controls which method of sensitivity analysis to perform, any additional options associated with that method, and (depending on the context) options that control how sensitivity graphs are to be displayed.
Overall, the options available are:
Sensitivity Settings Command Buttons
The Sensitivity Setting window includes its own Settings/Actions command button with the following options:


