Copula Fit Results
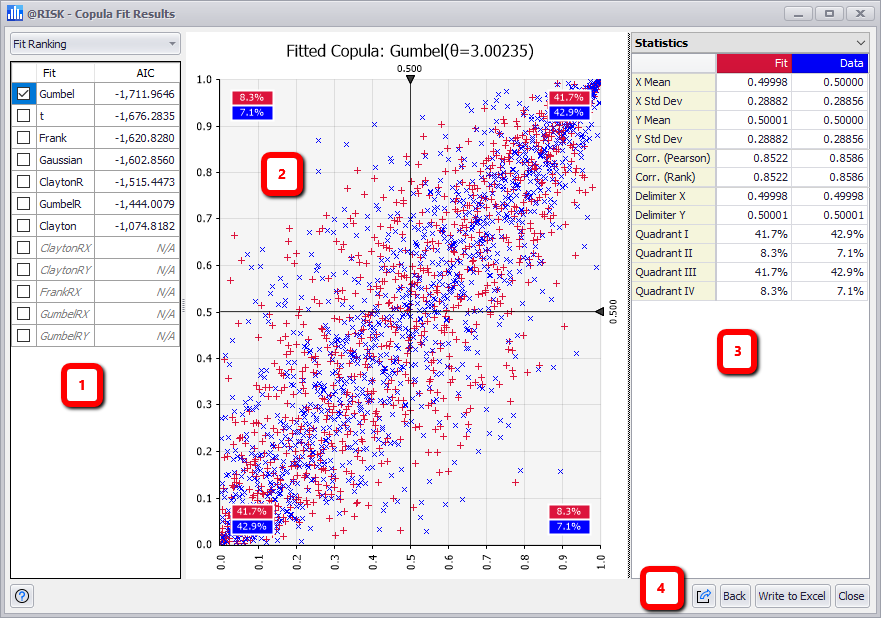
When a copula fit has completed, the results of the fitting process will be displayed in the Copula Fit Results window (Figure 1, below); from this window the results of each copula type that was tested can be viewed against the data used in the fitting process. Additionally, the fitting process will generate statistics on both the input data and the fitted copula.

Figure 1 - Copula Fit Results Window
Copula Fit Results Window
The Copula Fit Results window consists of the following primary sections:
- Copula Type List
- Fit Results Graph
- Information Panel
- Command Buttons
Copula Type List

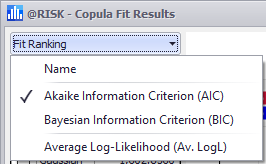
Figure 2 - Fit Sorting Menu
The left-hand panel of the Copula Fit Results window contains the list of fitted copula types. By default, these are ranked according to the ranking method that is selected in the pulldown menu located above the copula type list (Figure 2, right). Each copula type can be selected to view sample data of the copula compared to the actual data used in the fitting process; for example, in Figure 1, above, the actual data is graphed in blue while the sample values from the selected copula - Gumbel - are graphed in red.
Copula types that cannot be fit to the data will be displayed in grey. These copula types cannot be selected to view in the graph.
To view a copula type fit against the data, check the box next to its name in the list. Only one copula type can be selected at a time.
To sort the copula type list, or to change the ranking method, use the pulldown menu above the list. The options are:
Command Buttons
The Command Buttons for the Copula Fit Results window include:
 Help - Open help resources (online or local, based on @RISK settings); see
  Export - Commands for exporting the current fit data.
 Back - Go back to the Fit Copulas to Data configuration window.
 Write to Excel - Write the selected copula data to an Excel worksheet. See