Fit Results
When a Standard Fit is run, the results of that fit will display in the Fit Results window; from this window the results of each distribution function tested can be viewed against a summary graph of the data set, as well as the statistics for both the input data and the fitted distributions. A Batch Fit will always generate results in a separate worksheet (or worksheets) for each data set and the fitted distributions included in the Batch (either in the current workbook or in a new Excel workbook) depending on how the Batch Fit was configured. However, the data available for analysis is the same for both Standard and Batch Fit processes - it is only the presentation that differs. See Batch Fitting for more information on the Batch Fit process output.
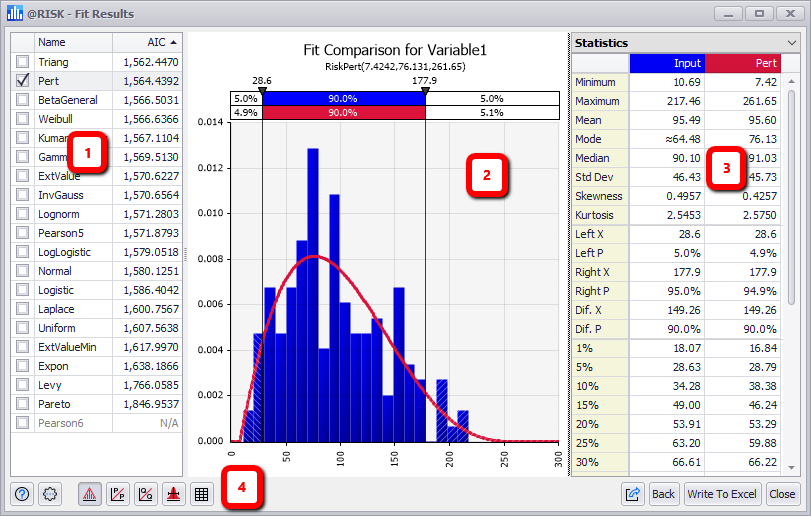
Figure 1 - Fit Results Window
Fit Results Window
The Fit Results window contains the following primary sections:
- Distribution List
- Fit Results Graph
- Information Panel
- Command Buttons
Fit Results Distribution List
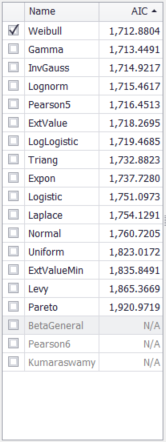
Figure 2 - Fit Results - Distribution List
The left-hand panel of the Fit Results window contains the list of fitted distributions (Figure 2, right); by default these are ranked according to the method that was chosen during the Fit Results Configuration. Each distribution can be selected to add the results of the distribution function to a comparison with the actual data; for example, in Figure 1, above, the data is graphed in blue while the selected distribution function - RiskGamma - is overlaid as the red line.
To view a distribution fit against the data, check the box next to its name in the list.
Multiple distributions can be selected simultaneously to compare fits to each other as well as to the data. Each new distribution selected will be added to the graph as a new line in a new color.