Batch Fitting
Batch Fitting follows the same process, and generates the same overall results, as a Standard Fitting for a single data set. There are some key differences, however, in how @RISK reports the results of a Batch Fitting. Additionally, some consideration of the data sets included is necessary when running a Batch Fit.
When running a Batch Fit, it is important to note that the configuration for the fitting process - including the list of distributions to test - must be the same for every data set included. If the fitting process needs to be run for both continuous and discrete data sets, each type must be run separately!
Batch Fit Results

Figure 1 - Batch Fit Output
The most significant difference between running a Standard Fit and a Batch Fit is the manner in which the results are reported; a Standard Fit will return the Fit Results window, whereas a Batch fit will generate several additional Excel worksheets (Figure 1, right) that contain the results and statistics of the fitting process for every data set included in the batch. For example, Figure 1 shows the resulting worksheets created when running a Batch Fit against four data sets; a Fit Summary sheet is created as well as detailed statistics for each of the data sets.
When setting up a Batch Fit, @RISK can be configured to add the new worksheets to the existing workbook or to a new workbook.
The exact data included in the results depends on the options set in the Results tab of the Fit Distributions to Data window (see Fit Results Configuration for more information); this includes whether or not detailed information on the individual fitting process for each data set is reported.
No matter where the new worksheets are generated, the output can include a few key components, outlined in the sections below.
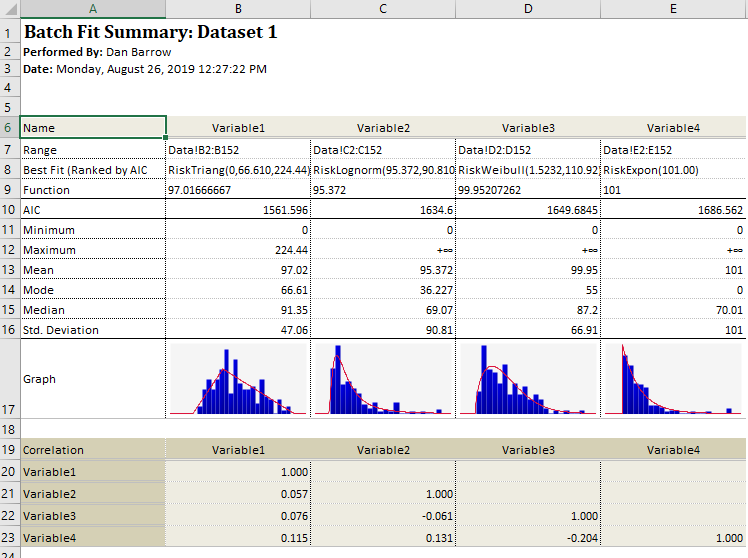
Figure 2 - Batch Fit Summary (including Correlations)
Fit Summary
The Fit Summary output (Figure 2, right) reports the basic information about the Best Fit distribution for each data set, including parameters, as well as statistics about the data set. A graph of the data set is also included, with the Best Fit distribution as an overlay.
Correlations (Optional)
If 'Include Correlations' is checked in the Results tab, @RISK will calculate and report the correlations between the included data sets. The correlation matrix created can then be used in the configuration of outputs and other distribution functions.
Individual Data Set Results (Optional)
If 'Include Detailed Report Worksheet for Each Fit' is checked in the Results tab, @RISK will create a new worksheet for each data set included in the batch. Each worksheet will include the fit statistics generated for each distribution. These statistics include the recommended distribution function and parameters as well as a breakdown of how that distribution ranked when using each of the Best Fit Methods (ie. AIC, BIC, etc.) for each distribution function.