Tornado Graphs

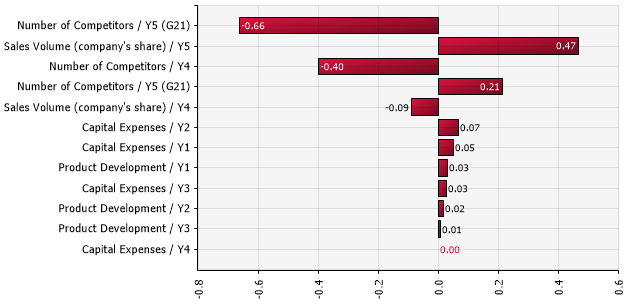
Figura 1 - Tornado Graph
@RISK Tornado graphs come from performing either sensitivity analysis or scenario analyses, both of which are different ways of analyzing how the inputs in a model drive the behavior of the outputs. Inputs with the largest impact on the distribution of the output have the longest (and topmost) bars in the graph.
Types of Tornado Graphs
There are a large number of tornado graph types, each of which is calculated in a different way. See Sensitivity Analysis and Scenario Analysis for more information. In the windows that display these graphs, the Sensitivity Analysis Settings options control the details of how tornados are created and displayed.
Drag and Drop from a Tornado Bar
It is possible to grab a tornado bar and drag it off the graph on top any empty space, it will create a scatter graph that shows off in more detail the relationship between the input represented by the bar and the output in question.