Scenario Analysis

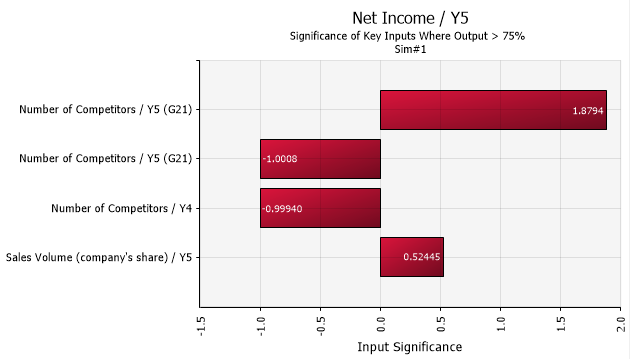
Figura 1 - Scenario Analysis Tornado Graph
Scenario analysis determines which input variables contribute significantly toward reaching a particular goal (called the target scenario or output scenario) associated with an output. For example, it can show which variables contribute to exceptionally high sales values, or which variables contribute to negative NPV values.
The technique is based on a conditional median analysis. @RISK finds the subset of iterations of the simulation in which the output variable achieves the target scenario. It then finds the median of this subset of samples (called the “subset median”) for each input and compares it to the median of the input values for all iterations (called the “overall median”).
The objective of this process is to find the inputs with a subset median that differs markedly from the overall median. If the subset median for the input variable is close to the overall median, the input variable is insignificant. This is because the values sampled for the input in the iterations where the target is achieved do not differ markedly from those for the entire simulation. However, if the subset median for the input variable is very different from the overall median, the input variable is marked as significant.
To quantify this idea, the significance of an input for a given scenario is defined as:
Significance = (Subset Median – Overall Median) / Standard Deviation
@RISK considers inputs considers inputs with an absolute significance of less than 0.5 to be insignificant to the scenario.
@RISK displays scenario results in either graphical or tabular format. A scenario Tornado graph displays a ranking of the key inputs responsible for reaching the goal.
The Scenarios Window on the Explore Menu shows the complete set of scenario results for the entire model.