Simulation Progress Window

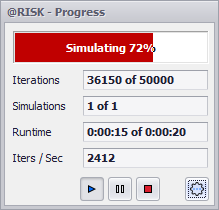
Figura 1 - Simulation Progress Window
Depending on how a simulation run is configured in the Simulation Settings window, @RISK may open one of several windows, or Excel may be minimized. These options include whether or not to show the Simulation Progress window (Figure 1, right); if the option is selected, the Simulation Progress will open, displaying the overall progress of the simulation run as well as other information. The Simulation Progress window includes:
Multi-CPU Simulations

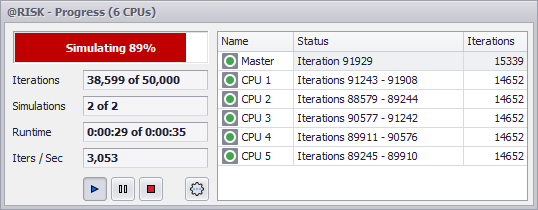
Figura 2 - Simulation Progress - CPU Monitor
When a simulation run is executed with Multiple CPUs enabled, the Simulation Progress window will open with the CPU monitor enabled; this option is also available from the Progress window Settings/Actions button, but will not display any information when multiple CPUs is not enabled (either manually, or through the 'Automatic' setting).
The CPU Monitor displays the status and progress for each of the independent processes that is running; in addition to status details in the 'Status' column and the number of iterations per second in the 'Iterations' column, there is a visual indicator for the status of each core. Green indicates a process that is working, yellow indicates a process that is in a waiting state (e.g. initializing or waiting for another dependent process to complete), and red indicates an error.
Simulation Progress Command Buttons

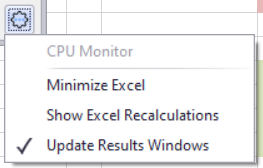
Figura 3 - Simulation Progress Tools Menu
The Simulation Progress window includes controls for starting, pausing, and stopping a simulation run, as well as a Settings/Actions button (Figure 2, right) that includes the following options: