Variation Methods
The Variation section in the Input Definition dialog configure the type of variation @RISK will use to select the test values for the input or inputs being added to the simulation. During an analysis, inputs are “stepped” across a range of possible values, with a full simulation run at each step value; the results of each of these simulations are then analyzed to determine the degree to which inputs have an effect on the output. The different Variation options provide a great deal of flexibility in describing how the input values will be tested.
Depending on the Variation method selected, the configuration options for step values will change. The options are detailed below
% Change from Base Value
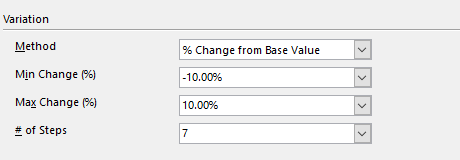
Figura 1 - Percent Change from Base Value Options
The first and the last value in the sequence to step through are obtained by incrementing, or decrementing, the input's Base Value (set in the input's configuration - see Advanced Sensitivity Analysis). The Base Value is modified by the percentages specified in Min Change (%) and Max Change (%) entries. The intermediate values are at equal intervals, with the number of values to test set by # of Steps.
Change from Base Value
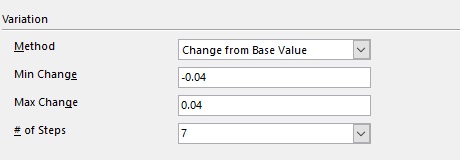
Figura 2 - Change from Base Value Options
The first and the last value in the sequence to step through are obtained by adding or subtracting from the input's Base Value (set in the input's configuration - see Advanced Sensitivity Analysis). The Base Value is modified by the values specified in Min Change and Max Change entries. The intermediate values are at equal intervals, with the number of values to test set by # of Steps.
Values Across Range
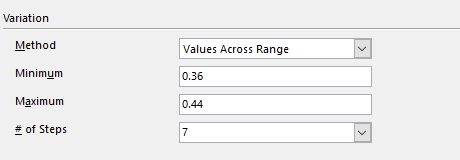
Figura 3 - Values Across Range Options
The sequence of values to step through starts at the Minimum and ends at the Maximum. The intermediate values are at equal intervals, with the number of values to test set by # of Steps.
Percentiles of Distribution
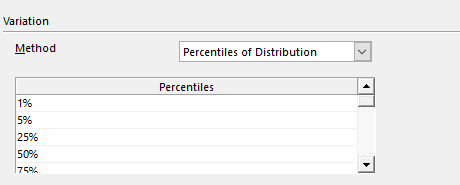
Figura 4 - Percentiles of Distribution Options
This Variation method is only available when the selected input Type is set to 'Distribution'. The sequence steps are specified as percentiles of the selected @RISK distribution; up to 20 steps can be defined.
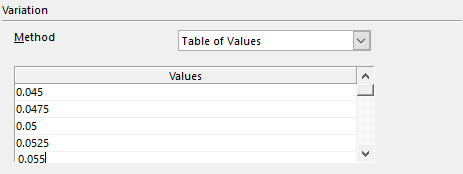
Figura 5 - Table of Values Options
Table of Values
Enter a sequence of values to step through directly in the table provided.
The Base Value setting is irrelevant when this option is selected, as only the specific values entered are tested.
Table from Excel Range
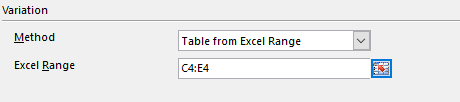
Figura 6 - Table from Excel Range Options
the sequence of values to step through is found in a range of worksheet cells in an Excel workbook.
This range can contain any number of values - however, please note that a full simulation will be run for each value in the referenced range.