Advanced Sensitivity Analysis
Advanced Sensitivity Analysis allows for the selection of a number of @RISK distributions or worksheet cells in a model, which are then used in trial simulations that vary each of these inputs across a specified range. The Advanced Sensitivity Analysis command of the Simulate menu runs this analysis to determine the degree to which the selected inputs have an effect on an @RISK output. Unlike typical @RISK sensitivity analysis, the inputs analyzed can be either an @RISK distribution or a simple cell reference to a value or formula within an Excel workbook - an analyzed input does not need to contain an @RISK input distribution function. Advanced Sensitivity Analysis runs a full simulation at each of a set of possible values for each input, tracking the overall simulation results at each value. These results then show how simulation results changed as the input values changed.
To run an Advances Sensitivity Analysis, select Advanced Sensitivity Analysis from the Simulate menu, configure the output and inputs (see below), and click Analyze.
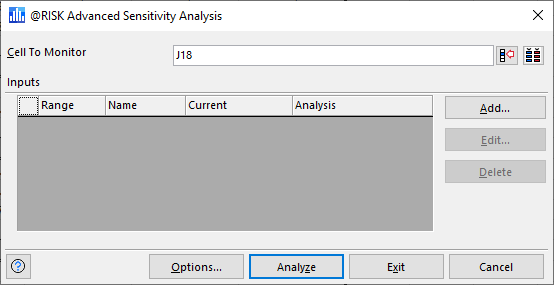
Figura 1 - Advanced Sensitivity Analysis Window
The Advanced Sensitivity Analysiswindow (Figure 1, right), contains the following configurations:
- Cells to Monitor - Select a single @RISK output to monitor during simulations, while stepping through possible input values.
-
Use the Model button (
 ) to open a list of outputs in the current model and quickly select one!
 - Inputs - The list of inputs that will be included in the simulation. See below for information on configuring inputs.
-
To add an input, click the Add button.
To edit or delete an input, select it in the list and click the Edit or Delete button.
Configuring Inputs
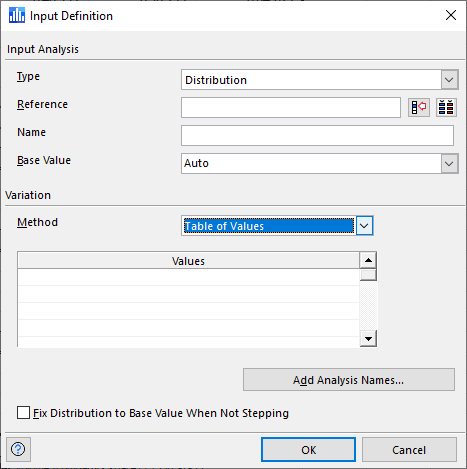
Figura 2 - Input Definition Window - Advanced Sensitivity Analysis
When the Add or Edit buttons (see above) are clicked, the Input Definition window (Figure 2, right) will open, allowing for a new input to be defined or an existing input to be modified. The Input Definition window contains the following configurations:
- Type - Specifies the type of input:
- Reference - The cell reference for the distribution to stress. Multiple inputs can be selected simultaneously if the variation method to be used for those inputs is identical.
-
Use the Model button (
) to open a list of inputs in the current model and quickly select one! This button is only visible when Type is set to 'Distribution'. - Name - The name of the input; for @RISK distribution functions, the distribution name will be used, whereas for Excel cells (values or formulas @RISK will use column headers (where available) or cell references for the Name value; these can be manually modified.
-
To modify the Name value (or values) for selected inputs, click the button to the right of the field (
); the Sensitivity Analysis Cell Names window will open. Modify individual cell names using the values in the Name column. Click OK when done. - Base Value - This value is used to determine the sequence of values to step through for an input, and as a reference point in the Percent Change report graph. The base value is especially important when utilizing a Variation Method that is a change from base, such as +/- Percent Change from Base.
-
Please note: If a distribution or cell evaluates to 0, and Base Value is set to 'Auto', it is necessary to enter a nonzero base value when using the +/- Percent Change from Base option for variations.
-
By default, the base value is the value a distribution or cell evaluates to when Excel recalculates the worksheet, but you can change it to a different value.
- Method - The type of variation @RISK will use to select test values for the input or inputs. See Variation Methods for more information.
Analyses Names
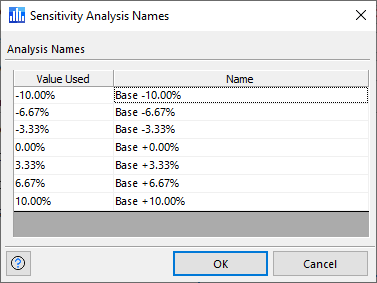
Figura 3 - Sensitivity Analysis Names Window
When working with an Advanced Sensitivity Analysis simulation, the selected inputs are analyzed at various points, or "steps", along their possible values. For each step, a full simulation is run and the results of that simulation are stored. To aid in reporting and analysis, each of the steps of an input (or a group of inputs if multiple inputs are selected together) can be given a name. To add or edit the names for each analysis, click the Add Analysis Names button in the Input Definition window; the Sensitivity Analysis Names window (Figure 1, right) will open.
The window displays a table showing the "step" value to be used for a given simulation, with the name for the simulation alongside. These names will be used to make reports more readable and to help identify individual simulations. @RISK creates default names, but these can be updated as needed.