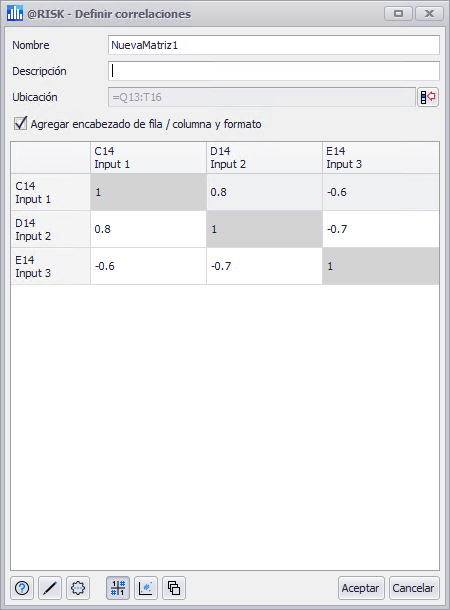
Define Correlation Coefficients

Figura 1 - Define Correlation Window
To add or edit a correlation matrix to an @RISK model, click the top portion of the Correlation button in the @RISK ribbon, or open the Correlation menu and select 'Define Correlation Matrix'. This will open the Define Correlations window (Figure 1, below). Depending on what is currently selected in the worksheet, one of two windows will open.
An input distribution can only be a part of a single correlation.
If the selected cell or cells contain input distributions but are not a part of existing correlations, the Define Correlations window will open and a new correlation matrix will be started. The new matrix will not include any coefficients.
If the selected cell or cells are a part of an existing correlation - either the included input distributions or a cell within the correlation matrix data (Figure 2, below) - the Define Correlations window will open with the existing correlation matrix configuration.

Figura 2 - Formatted Correlation Matrix
If the selected cell or cells are empty, or include anything other than an input distribution or correlation matrix, @RISK will show a prompt asking that at least two input distributions be selected. Select the appropriate input distributions and click 'OK'; if no input distributions are selected and 'OK' is clicked, a new correlation matrix will be created with two missing inputs.
A correlation matrix - by its very nature of representing the relationship between probability distributions - must include at least two input distributions; if only a single input distribution is selected, the correlation matrix will be started with a missing input. It is generally recommended that missing inputs are added to a new correlation before inserting the matrix into the worksheet. See Edit Correlation Matrix for information on adding or removing inputs to a correlation after it has been created.
Entering Coefficients
The main panel of the Define Correlations window is the correlation matrix; this matrix is where coefficients are entered representing the relationships between inputs. When creating repeated correlations with multiple instances, the correlation matrix is created once and then applied to each instance of input distributions. For more information on correlations, their component pieces, and how to build them, see the Correlations pages in the About section, under Statistics.
To enter a coefficient value, click in its cell; this will select the existing value and a new value can be entered. Hit 'Enter' or click outside the cell to accept the value.