Define Correlation Window
After inputs have been selected, or when editing an existing correlation, the Define Correlations window (Figure 3, below) will be displayed. The Define Correlations window allows for the configuration of correlations between two or more input distributions. By default, the window has three separate views, with a fourth added when Adjustment Weights are enabled (see Correlation Adjustment Weights for more information). Each view is accessed using the middle Command Buttons:
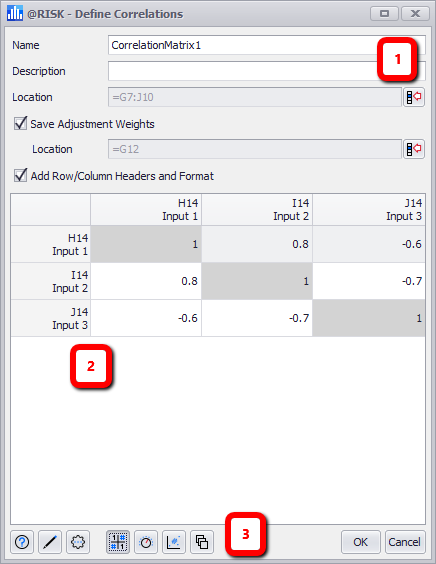
Figure 1 - Define Correlations Window
Define Correlations Window
The Define Correlations window consists of the following primary components:
- Configuration Panel
- Correlation Matrix (alternately, this will display the Adjustment Weights, the Graphs, or the Instance Editor)
- Command Buttons
Correlation Configuration Panel
The top panel of the Define Correlations window includes options for configuring the appearance of the matrix that will be inserted into the worksheet. The options include:
When adding row and column headers, @RISK will use the name of the input; see Automatic Names for more information on how @RISK determines input names.
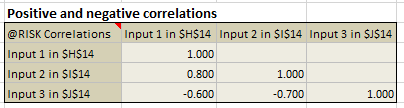
Figure 2 - Formatted Correlation Matrix
In some circumstances, @RISK may use a text value located several rows or columns away from the selected input; these values cannot be edited in the Define Correlation window. If incorrect values are being used and formatting of the correlation matrix is necessary, it is recommended that either manual formatting is applied to the header cells, or the inputs included in the matrix are named appropriately.
Define Correlation Coefficients
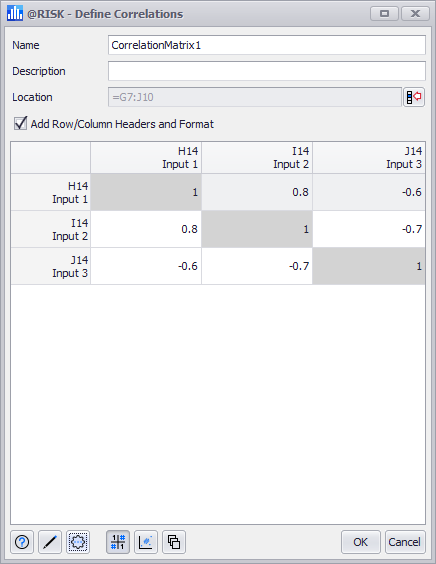
Figure 3 - Define Correlations Window
An input distribution can only be a part of a single correlation.
If the selected cell or cells contain input distributions but are not a part of existing correlations, the Define Correlations window will open and a new correlation matrix will be started. The new matrix will not include any coefficients.
If the selected cell or cells are a part of an existing correlation - either the included input distributions or a cell within the correlation matrix data (Figure 4, below) - the Define Correlations window will open with the existing correlation matrix configuration.
Figure 4 - Formatted Correlation Matrix
If the selected cell or cells are empty, or include anything other than an input distribution or correlation matrix, @RISK will show a prompt asking that at least two input distributions be selected. Select the appropriate input distributions and click 'OK'; if no input distributions are selected and 'OK' is clicked, a new correlation matrix will be created with two missing inputs.
A correlation matrix - by its very nature of representing the relationship between probability distributions - must include at least two input distributions; if only a single input distribution is selected, the correlation matrix will be started with a missing input. It is generally recommended that missing inputs are added to a new correlation before inserting the matrix into the worksheet. See Edit Correlation Matrix for information on adding or removing inputs to a correlation after it has been created.
Entering Coefficients
The main panel of the Define Correlations window is the correlation matrix; this matrix is where coefficients are entered representing the relationships between inputs. When creating repeated correlations with multiple instances, the correlation matrix is created once and then applied to each instance of input distributions. For more information on correlations, their component pieces, and how to build them, see the Correlations pages in the About section, under Statistics.
To enter a coefficient value, click in its cell; this will select the existing value and a new value can be entered. Hit 'Enter' or click outside the cell to accept the value.