Simulation Statistics
The Statistics window (Figure 1, below) lists all output and inputs of a model and the calculated statistics of those elements based on data generated during the simulation run. Each element is a column; if multiple simulations were executed during the simulation run, each element will be included for every simulation in its own column. Figure 1, below, demonstrates the Statistics window for a simulation run that included two simulations - every element is listed twice.
Drag-and-drop an element's thumbnail graph off the Statistics window to open that element in a new Browse Results window!
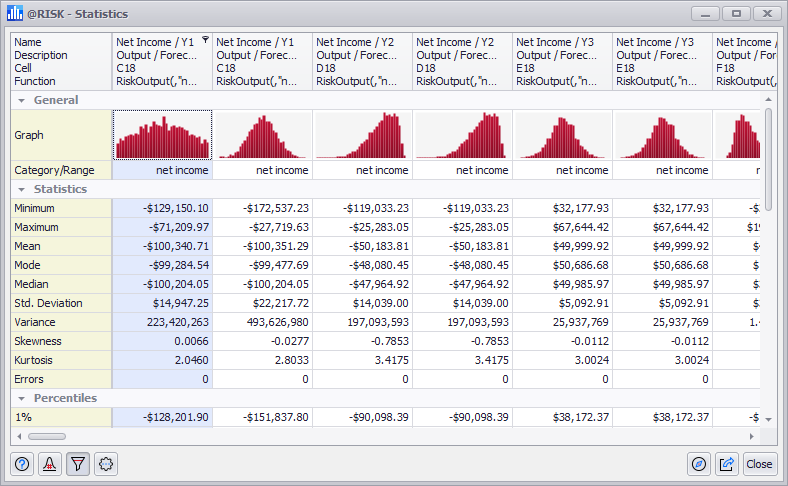
Figure 1 - Statistics Window
The Statistics window (Figure 1, right) includes several collapsible sections:
Statisics Window Command Buttons
The options available only in the Statistics window are:
-
 Settings/Actions - Window-specific setting options and commands. The Statistics window Settings/Actions are: