Configuring Percentiles
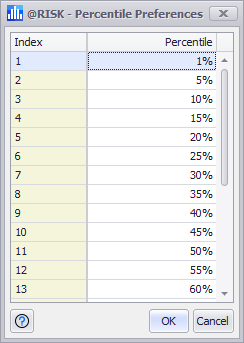
Figure 1 - Percentile Preferences Window
Numerous windows and graphs display percentiles for @RISK theoretical and simulated distributions. The percentile option configures which percentiles should be reported in these windows and graphs, and how the percentiles should be displayed. There are two sets of options that, when configured together, enable precise control over how @RISK displays results. First, percentiles can be displayed in either cumulative ascending or cumulative descending format. The default Cumulative Ascending format reports a percentile as the probability that a distribution or simulated output value is less than or equal to a given x-value. The alternative Cumulative Descending percentile option instead returns the probability that a distribution or simulated output value is greater than a given x-value.
A change to the percentile display mode requires @RISK to be closed and restarted before it will take effect.
Please note: Selecting descending percentiles also causes @RISK to default to the entry of cumulative descending percentiles when Alternate Parameter distributions are used in the Define Distribution window.
Percentile Preferences
The second set of options configures which percentiles should be calculated; clicking the 'Define' button opens the Percentile Preferences window (Figure 1, above right), where the specific percentiles can be modified. The window is organized into two columns - Index and Percentile - detailing the total number of percentile thresholds and their values.
To modify an existing percentile, click its value to select it and enter a new value. Enter integer values to set a specific percent (e.g. '50', not '0.5', for 50%); decimal values are also possible.
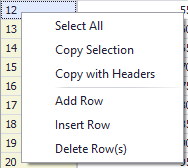
Figure 2 - Percentile Preferences Context Menu
To add a percentile, enter a value in the Percentile field of the last row and hit 'Enter'. Alternately, right click a row to open the context menu (Figure 2, left), and select 'Insert Row' to create a new row below the selected row, or 'Add Row' to add a new row to the bottom of the table. Enter a percentile value for the new row.
To delete a percentile, either select the row and hit 'Delete' or right-click on the row and select 'Delete Row(s)'
Some reports have a limited number of percentiles that can be displayed. If more percentiles are specified than can be actually shown, @RISK will work its way “outside-in” choosing the most extreme percentiles on either side, along with the center percentile (typically the 50th percentile).