Simulation Data
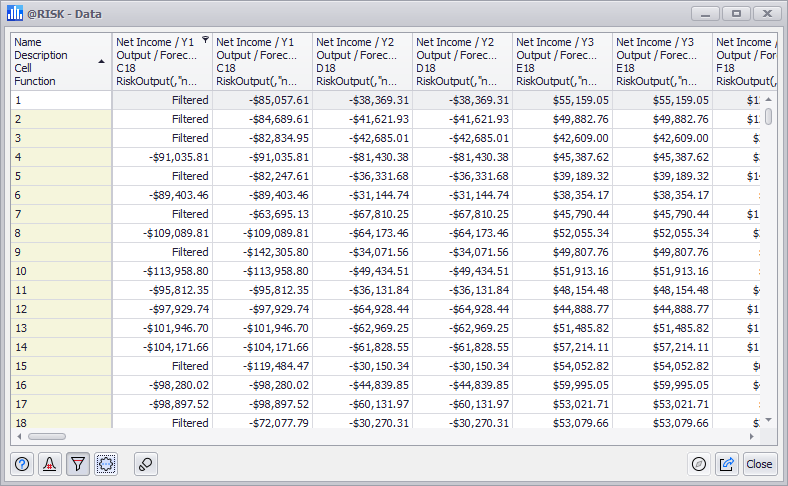
Figure 1 - Simulation Data Window
The Data window (Figure 2, right) contains all of the sample values for the entire simulation run. Each element is a column; if multiple simulations were executed during the simulation run, each element will be included for every simulation in its own column. Every iteration in the simulation run is a row.
Figure 2, right, demonstrates the Data window for a simulation run that included two simulations - every element is listed twice.
To select an element, click its column header, or click to select any cell in its column.
To select an iteration, click the row number, or click to select any cell in its row.
Data Window Command Buttons
The options available only in the Statistics window are:
-
 Settings/Actions - Window-specific setting options and commands. The Data window Settings/Actions are:
 -
 Step Through - Update the model with the selected iteration's values. See below for more information.
 -
Sorting the Data Window
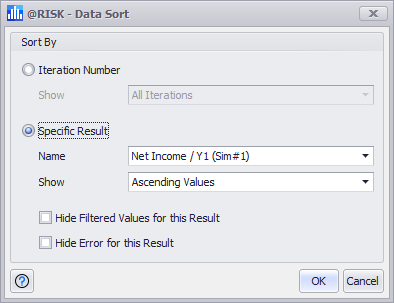
Figure 2 - Data Sort Window
By default, the Data window is sorted ascending by iteration number. However, the data can be sorted by any element by using the Sort Data command; selecting this option from the Settings/Actions button will open the Data Sort window (Figure 3, right). The Data Sort window comtains the following configurations:
Stepping Through Data
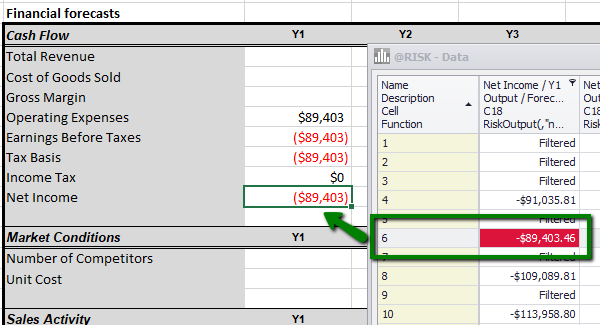
Figure 3 - Step Through Tool
One of the tools available through the Data window is the "step through" tool that enables viewing the sample values for a specific iteration in the model worksheet. This can be a very useful tool for analysis of iterations that contain outlier values for their distributions or those that encountered an error. "Stepping through" the data will load the iteration into the model so that every input and output can be checked and verified.
The Step Through tool is toggled on and off; when it is enabled, selecting any cell in the Data window will load that iteration into the model.