Browse Results Window
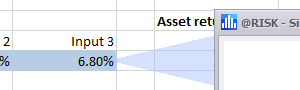
Figure 1 - Browse Results Callout Arrow
The Browse Results window (Figure 2, below) is the primary interface for Browse Mode, and one of the most common methods for analyzing the results of a simulation. The contents of the Browse Results window will update to display information about an input or output when that element is selected; @RISK uses a callout (Figure 1, right) to indicate which element is currently selected in the model.
Browse Mode enables quickly switching between elements of a model - inputs and outputs - while displaying detailed information about the selected element within the context of a simulation run. For example, figure 1 below, displays an output of the model including a distribution graph of the simulation results, detailed statistics for the output, and several commands for quickly switching between views in the command button area of the window.
A Browse Results window can be open even when not in Browse Mode; for example, selecting an option from the Simulation Graphs section of the Explore Menu will open a Browse Results window but will not enable Browse Mode. See Browse Window Views for more information about simulation graphs.
The primary method of switching between elements of a model is manually selecting the element by clicking its cell. If the selected cell does not contain an @RISK input or output, the Browse Results window will not change.
Additionally, by pressing 'Alt + →' (right arrow) or 'Alt + ←' (left arrow) it is possible to cycle through outputs.
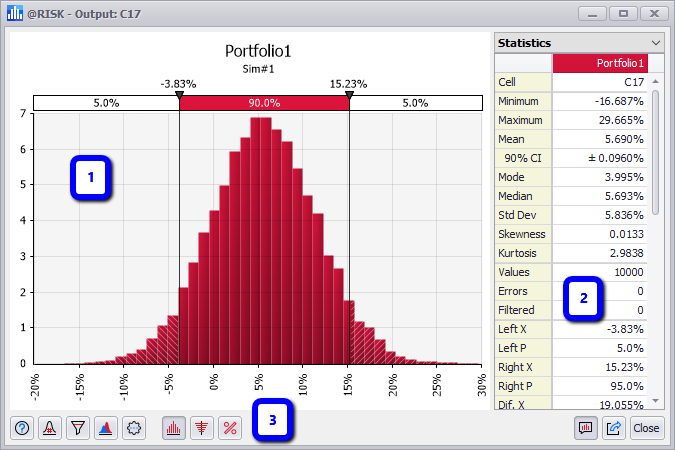
Figure 2 - Browse Results Window
Browse Results Window
The Browse Results window contents will change based on the element selected. The window contains three primary components:
- Graph Panel
- Information Panel
- Command Buttons (see below)
Element Graph and Statistics
When the Browse window first opens, it will display the graph and statistics for the selected element (or the first output that it finds, starting from the upper left corner of the worksheet) using the default graph configuration as established in Graphing Preferences. Additionally, the statistics for the selected element will be displayed in the Information panel to the right of the graph; this display can be changed using the pull-down menu at the top of the panel, changing the display to a legend, the statistics, or a grid containing the element's simulation data.
For more details on the views available in the Browse Results window, see Browse Results Command Buttons.