Stress Analysis Results
The reports available for a Stress Analysis include a summary report, a quick report, and several types of graphs. The reports returned by an analysis are selected in the Stress Analysis Options window when the Stress Analysis simulation is configured. Below are details on the various types of reports that can be generated.
Summary Report
A Summary (Figure 1, below) describes the stressed inputs, and lists the corresponding statistics of the monitored output: Mean, Minimum, Maximum, Mode, Standard Deviation, Variance, Kurtosis, Skewness, 5th Percentile, and 95th Percentile.
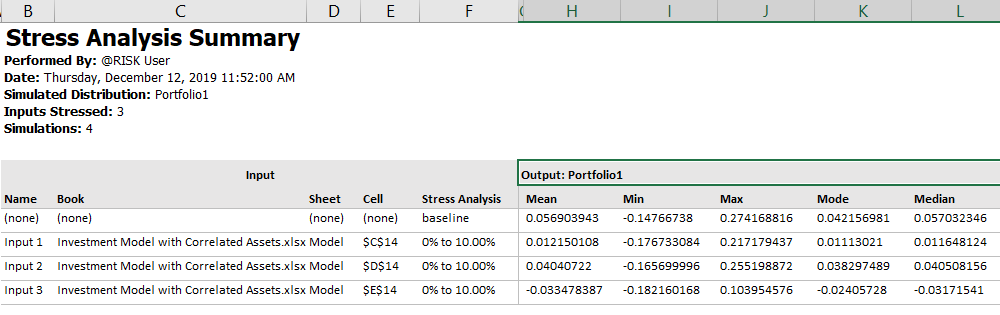
Figure 1 - Summary Report Example
Quick Report
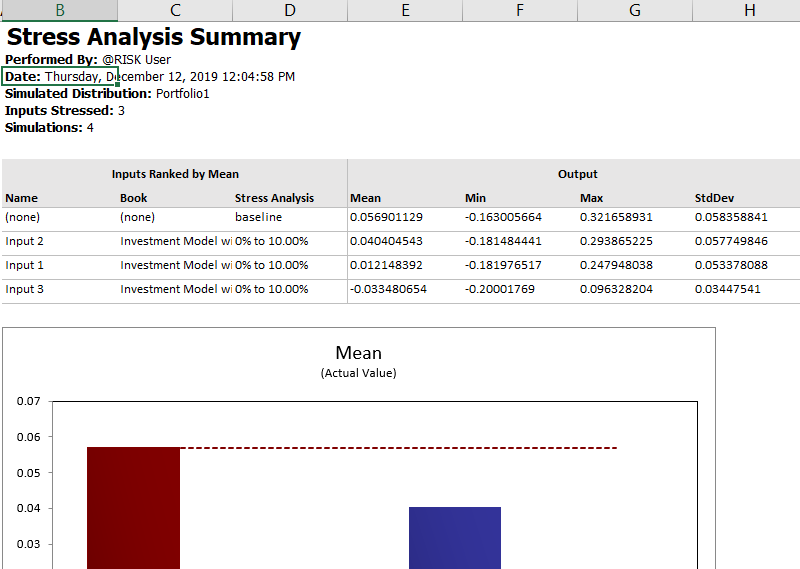
Figure 2 - Quick Report Example
A Quick Report (Figure 2, below) provides a single page-formatted summary of the Stress Analysis as a whole. This report is designed to fit on standard paper and is ideal for printing. It includes the same graphs that are available separately through Stress Analysis Options.
Stress Analysis Graphs
The purpose of the Stress Analysis graphs are to enable comparing the results of stressing each input against the “base” case where there is no stressing. The possible graphs are:
Comparison Graph
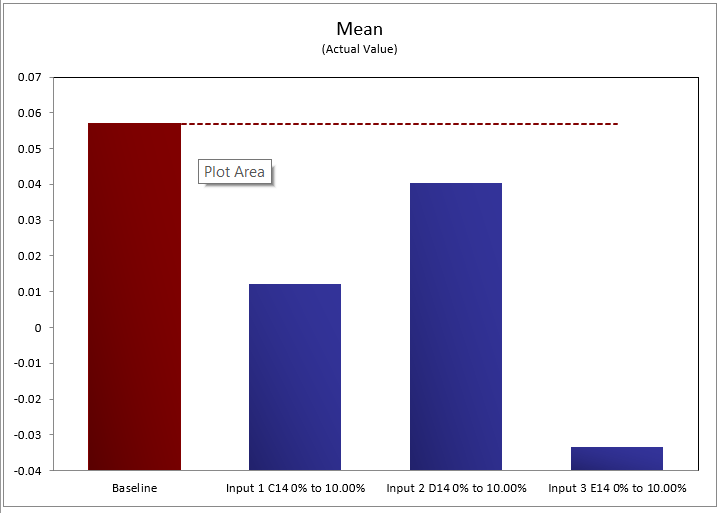
Figure 3 - Comparison Graph Example
The Comparison Graph option generates a standard bar graph for each statistic (Mean, Median, etc.) that displays each of the stressed inputs alongside the baseline (unstressed) value.
Box-Whisper Plot
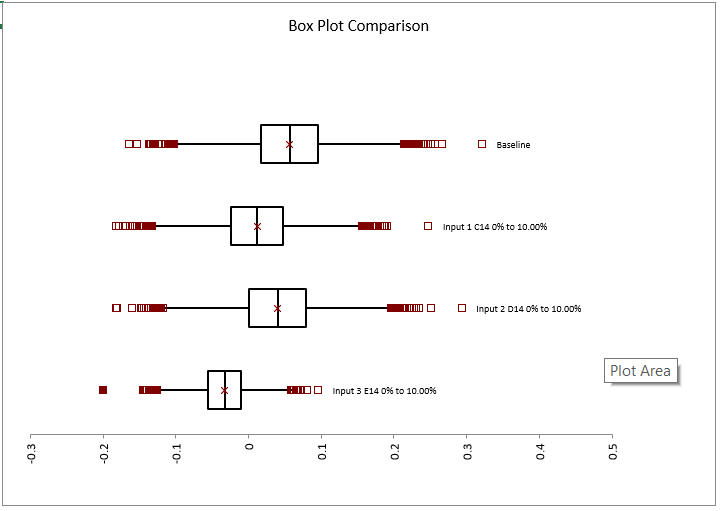
Figure 4 - Boxplot Graph Example
This graph displays a boxplot of both the baseline and each of the stressed inputs. A box plot displays the summary of a set of data for five statistics - the minimum, first quartile, median, third quartile, and maximum. The box spans the first quartile to the third quartile and a vertical line marks the median.
Histogram
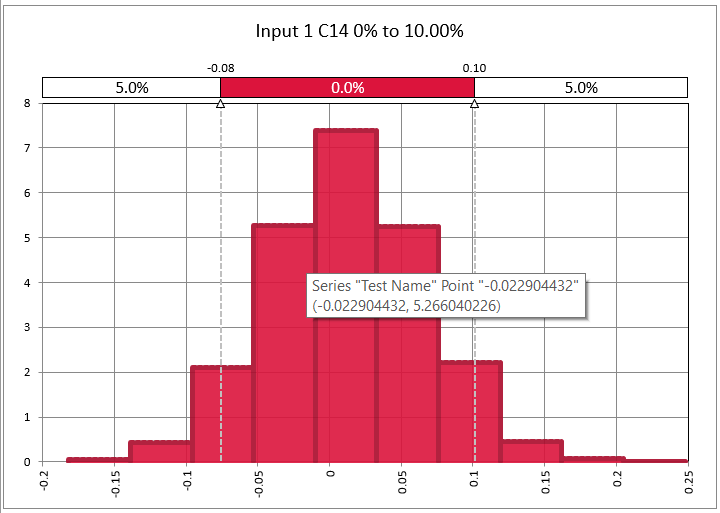
Figure 5 - Histogram Example
The Histogram option creates a histogram for both the baseline and each of the stressed inputs, adding all graphs to the same worksheet.
Cumulative Distribution Functions (CDF)
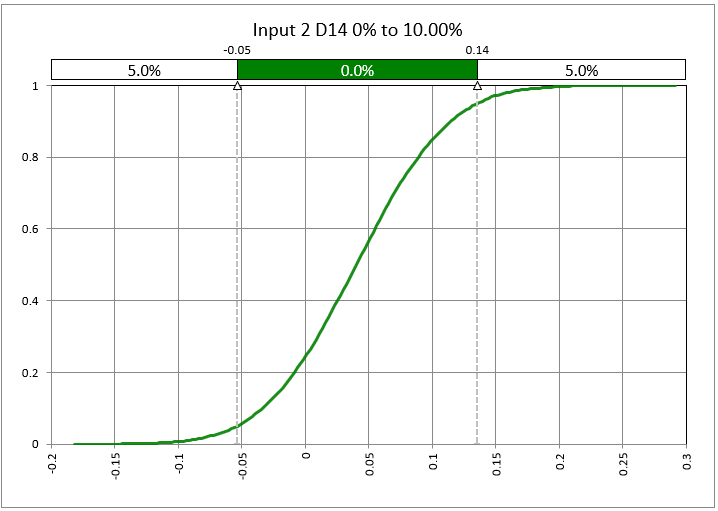
Figure 6 - Cumulative Distribution Function Example
Similar to the Histogram option, the CDF - or Cumulative Distribution Function - option will create a cumulative distribution graph for both the baseline and each of the stressed inputs and add those graphs to the same worksheet.