Fit Data Types

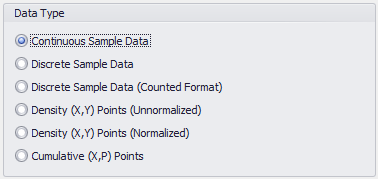
Figure 1 - Fit Data - Data Type

In order for the fitting process to be most effective, the type of data set being analyzed needs to be designated; this is done in the Data Type section of the Data tab (Figure 1, right). Additionally, the list of distributions available will change based on the Data Type that is selected. See Selecting Distributions for Fit for more information about choosing distributions during the fitting process.

The Data Type selections are:

  • Continuous Sample Data - Specifies that the data are a sample from a continuous population. The sample data are used to estimate the properties of that population. The data can be in a column, a row, or a block of cells in Excel.
  • Discrete Sample Data - Specifies that the data are a sample from a discrete population, where only integer values are possible. The data can be in a column, a row, or a block of cells in Excel.
  • Discrete Sample Data (Counted Format) - Specifies that the data are from a discrete population in Counted Format; the input data will be in the form of (X, Count) pairs, where Count specifies the number of data values equal to X. The data must be in two columns in Excel, with the X values in the first column, and the corresponding Count values in the second column.
  • Density (X,Y) Points (Unnormalized) - Specifies that the data are from a density curve in the form of (X, Y) pairs; the Y value specifies the relative height of the density curve at each X value. The data must be in two columns in Excel, with the X values in the first column, and the corresponding Y values in the second column.
  • Density (X,Y) Points (Normalized) - Specifies that the data are from a density curve in the form of (X, Y) pairs. The Y value specifies the height of the density curve at each X value. The data must be in two columns in Excel, with the X values in the first column, and the corresponding Y values in the second column.
  • Typically, this option is used if the Y data are taken from a curve that has already been normalized (the area under the curve is 1). It is recommended that you select this option to improve fitting of density curve data.

  • Cumulative (X,P) Points - Specifies that the data are from a cumulative curve in the form of (X, p) pairs, where each pair has a X value, and a cumulative probability p that specifies the height of the cumulative probability curve at that X value. A probability p represents the probability of a value occurring that is less than or equal to the corresponding X value. The data must be in two columns in Excel, with the X values in the first column, and the corresponding p values in the second column.