Defining Fit Data
Once a data set has been selected it can be fit to various distributions to determine which would mostly likely produce that data set. The first step in the process is to define the characteristics of the data set (or sets) in the Data tab of the Fit Distributions to Data window.
If a single data set is to be fitted, click the Fit button and select 'Fit'.
If multiple data sets are to be fitted simultaneously, click the Fit button and select 'Batch Fit'. Note that all data sets must use the same fitting configuration when run in batch mode, including which distributions will be tested.

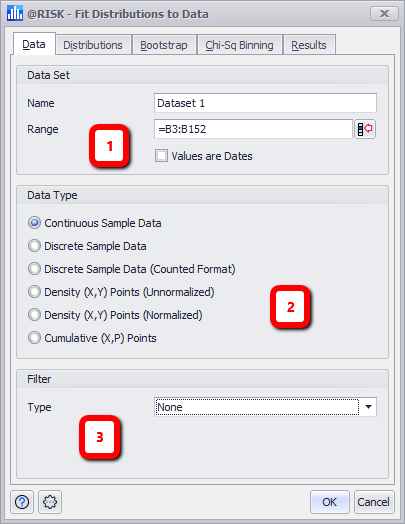
Figure 1 - Fit Distributions to Data - Data Tab
Data Tab
The Data Tab consists of the following primary sections:
- Data Set - Details of the data to be included in the Fit, including a Name value which will appear as the name of the fit in the Fit Manager window. See below for more information.
- Data Type - Configure the type of data set chosen.
- Filter - Filter the data set values; this can be set to use absolute or relative values.
Data Set
The Data Set panel is the primary definition of the data to be included in the Fit.
Data Type
This section designates what type of data set is being used for the Fit. The type of data (e.g. continuous or discrete) will greatly affect the distributions that are available to test for fit.
It is key that the Data Type configuration is set correctly for the fit process to be effective. The Data Type selection designates that the data set is a random sampling (continuous or discrete) versus points on a curve (density) versus points on a cumulative curve (cumulative). This choice is a fundamental part of the fitting process.
See Fit Data Data Types for more information.
Filter

Figure 2 - Absolute Filter

Figure 3 - Relative Filter
Filtering settings for the data set allow for the exclusion of certain values from the fitting process, without the need to exclude those values from the designated Excel range. This can be particularly useful when attempting to fit large data sets.
There are three options for Filtering: