Distribution Delimiters & Markers
Distribution Delimiters

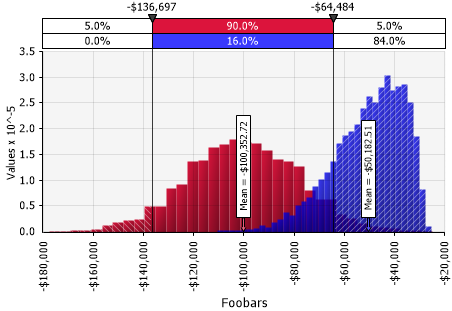
Figure 1 - Distribution Graph Delimiters
Two vertical delimiters are available on distribution graphs. By default, the delimiters are placed at the 5th and 95th percentiles (Figure 1, right). By dragging the delimiters, target probabilities or percentiles can be computed and displayed. This is useful for graphically displaying answers to questions such as 'What is the probability of a result between one million and two million occurring?' or 'What is the probability of a negative result occurring?'.
The delimiter calculations are summarized succinctly in the delimiter bar at the top of the graph. In the example above, the left delimiter is set at the 5th percentile which has a value of -$138,360, the right delimiter is at the 95th percentiles which has a value of -$64,046.
To change the placement of a delimiter, drag the handle above the graph. Alternately, the values for the delimiters can be entered manually; click the percentage values inside the bar to enter a percentile or click the values above the bar to enter a value.

Figure 2 - Distribution Graph Multiple Delimiters
If multiple distributions are displayed in a single graph, the delimiter bar will show the probabilities for each of them (Figure 2, right). The color of each bar corresponds the color of the distributions in the graph.
The delimiters and delimiter bar have several display configuration options associated with them which can be found on the Delimiter Tab of the Graph Options dialog. The default delimiters for all graphs can be modified in the Graph Options dialog.
Distribution Markers

Figure 3 - Topic Text
Distribution graphs can be decorated with markers that demonstrate various statistics or values of interest. For example, Figure 3 at right includes markers for the mean of each distribution included in the graph.
To add or edit markers for a graph, select Graphing Preferences from the Settings/Actions menu, then select the Markers tab.
The Markers Tab of the Graph Options dialog allows you to configure these markers.
Since v8.5.0, cumulative ascending and descending distribution graphs display horizontal markers next to the curve pointing to the corresponding probability in the Y axis. Markers on multiple curves are still displayed vertically to prevent overlapping.