Probabilistic Gantt Data Report
The Probabilistic Gantt Data Report creates a table with the simulation results statistics required to generate a Probabilistic Gantt. This report can be created from the Schedule Menu under the Report menu:

The dialog contains a set of options for customizing the report:
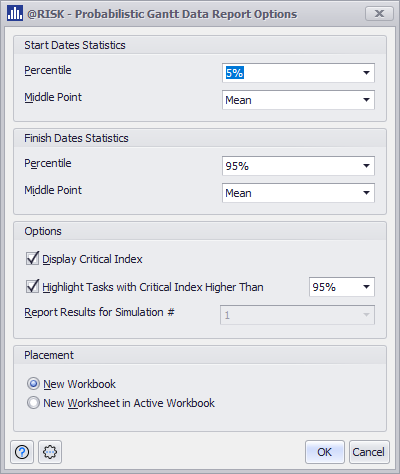
Start and End Dates statistics: allows to define the Percentile and Middle point statistics for the probabilistic bar Tails and MidPoint arrows.
Note: Make these options the same as your Gantt Preference Options, so you get the same simulation results from your Probabilitic Gantt Chart window on an Excel worksheet.
Display the critical index – select to include a column with the critical index calculated during the simulation process and highlight the tasks that match the critical index condition determined in the options.
You can export the report to a new Excel spreadsheet or an Active workbook as a new worksheet.
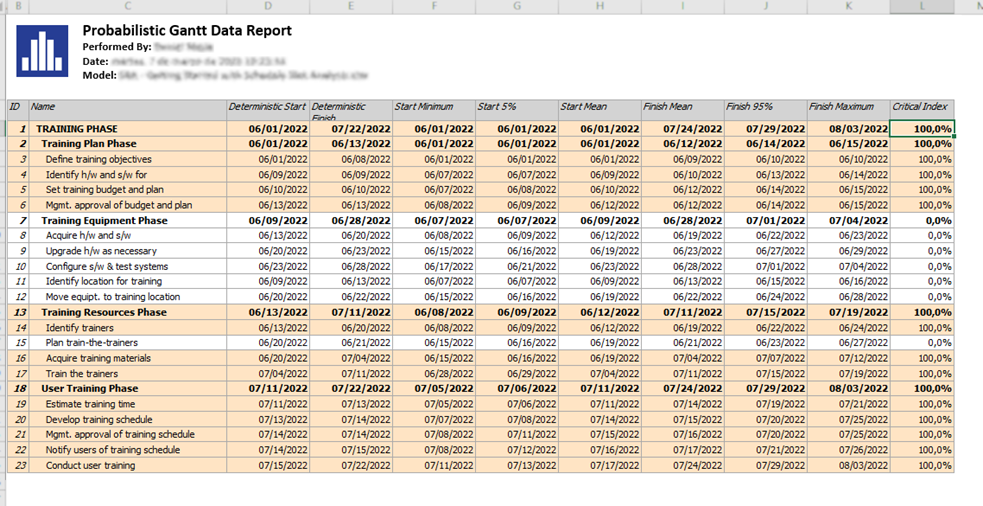
The report contains the following sections:
The rows are highlighted depending on the condition defined in the report’s dialog.