Progress Tab
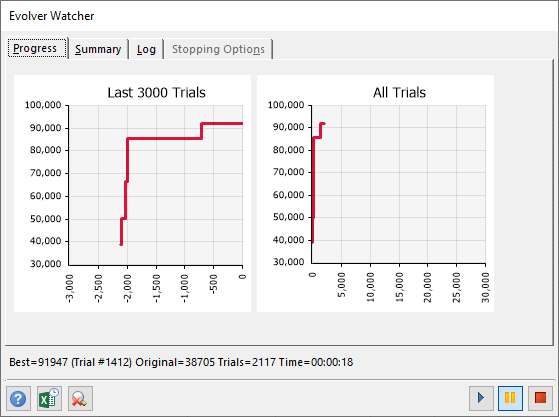
Figure 1 - Evolver Watcher - Progress Tab
The Progress Tab graphically shows how results are changing, by trial, for the target cell. Two progress graphs show the trial count on the X-axis and target cell value on the Y-axis; the left graph displays the results from the last 2000 trials run and the left graph shows results for all trials together.
Right-click either graph to display the Graph Options dialog, where either graph can be customized.