Diversity Tab
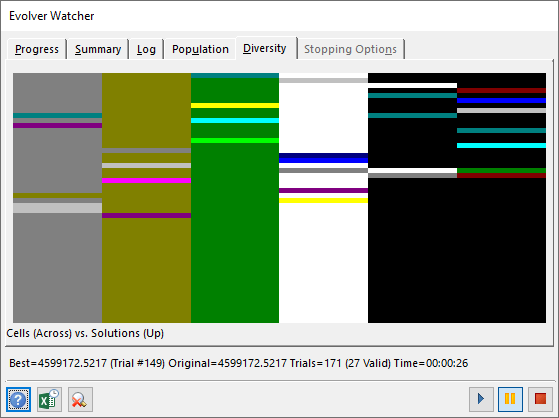
Figure 1 - Evolver - Model Window
If the Genetic Algorithm engine is being used, the Diversity tab (Figure 1, right) will be displayed in the Evolver Watcher window. The plot on the Diversity tab assigns colors to adjustable cell values, based on how much the value of a given cell differs across the population of organisms (solutions) that are stored in memory at a given point in the optimization.
Using the genetic optimization terminology, this is an indication of the diversity that exists in the gene pool. The graph is structured as follows:
- Each vertical bar in the plot corresponds to one adjustable cell.
- Horizontal stripes within each bar represent the values of that adjustable cell in different organisms (solutions).
- The colors of the stripes are assigned by dividing the range between the minimum and maximum value for a given adjustable cell into 16 equal-length intervals; each of the intervals is represented by a different color.