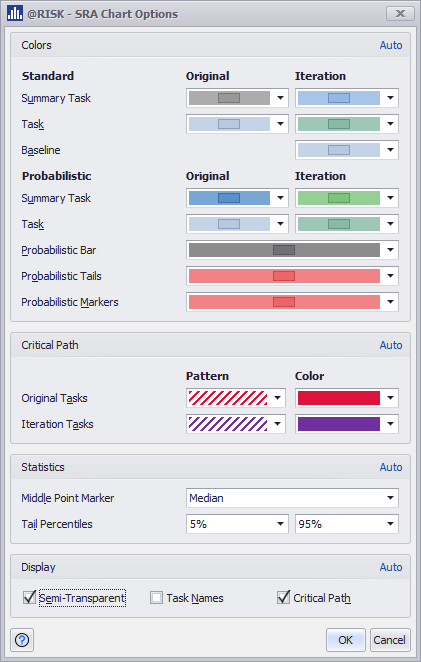
Gantt Chart Options
The Gantt Chart Options dialog allows for customization of Gantt Chart colors, displayed statistics and other options. This window is accessible from the Settings/Action button of the Gantt Chart window. It can also be accessed quickly from the Gantt Chart's right-click menu. The dialog works in similar ways as the Graph Options dialog for the other graphs.
This dialog overrides the defaults defined in the Graphing Preferences dialog. Each group of settings includes an Auto option, that is toggled by default. To modify the Gantt Chart options for the current model, uncheck the Auto option in the upper right corner of each group.
The following options are available:
Colors – Set colors of Task Bars, Baselines, Probabilistic Bars and Markers displayed in a Gantt Chart. Colors for Standard and Probabilistic mode can be set up independently.
Critical Path
- Pattern – Set the fill pattern to highlight the critical path tasks in the Gantt Chart for Standard and Probabilistic mode.
- Color – Set the color of the fill pattern set to highlight the critical path tasks in the Gantt Chart for Standard and Probabilistic mode.
Statistics
- Middle Point Marker – Set the statistic to be displayed as middle points of the Start Date and Finish Date. Available options are: Mean and Median.
- Tail Percentiles – Select the Lower Percentile of the Start Date and the Upper Percentile of the Finish Date, that are displayed in the Probabilistic Bars as Tails with different a color.
Display
- Semi-Transparent – This option makes the Task Bars and other elements semi-transparent or solid.
- Task Names – Decide if the Task Name should be displayed next to each Task Bar in the chart.
