Stress Analysis Simulations
The Stress Analysis command of the Simulation menu will run an analysis of the effects of stressing @RISK distributions. “Stressing” a distribution restricts samples drawn from the distribution to values between a specified pair of percentiles (e.g. only values that fall between the 30th and 60th percentiles). Alternatively, stressing can be done by specifying a new “stress” distribution that will be sampled instead of the original distribution in a model. With Stress Analysis a number of @RISK distributions can be selected simultaneously and simulations run while stressing these distributions jointly - either in one simulation, or separately in multiple simulations. By stressing the selected distributions, analysis of scenarios can be done without changing the overall model.
After completing a simulation, Stress Analysis provides a collection of reports and graphs useful for analyzing the effects of stressing certain distributions on the selected model output.
To run a Stress Analysis simulation, select Stress Analysis from the Simulate menu, configure the output and inputs (see below), and click Analyze.
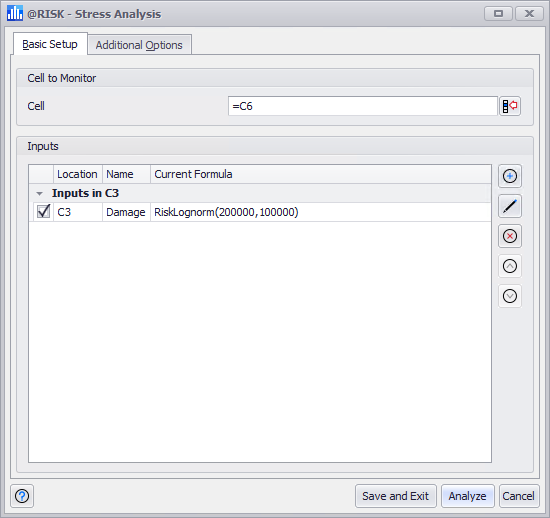
Figure 1 - Stress Analysis Window
The Stress Analysis window (Figure 1, right) contains the following configurations:
To add an input group to be stressed, click the Add (  ) button.
To edit or delete an input, select it in the list and click the Edit (  ) or Delete (
  ) button.
To reorder input groups, select an input group and use the Up and Down arrows
Configuring Stressed Inputs
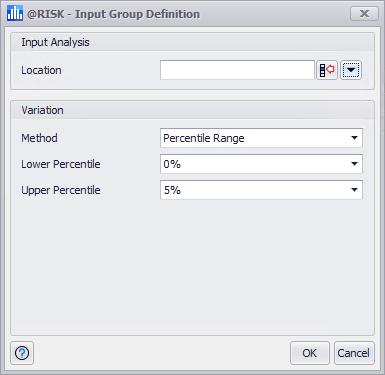
Figure 2 - Input Group Definition Window - Stress Analysis
When the Add or Edit buttons (see above) are clicked, the Input Group Definition window (Figure 2, right) will open, allowing a new input to be defined or an existing input to be modified. The Input Definition window contains the following configurations:
- Location - The cell reference for the distribution to stress. Multiple inputs can be selected simultaneously if the variation method to be used for those inputs is identical.
-
Use the Range pulldown (
 ) to open the Range panel where cell ranges - both contiguous and non-contiguous - can be defined.
 Cell ranges of inputs can be grouped together using these ranges.
- Method - Select the method of variation for the input distribution during the analysis. The options are:
- Lower Percentile - Set the specific percentile to be used as the lower limit; any percentile value can be set.
- Upper Percentile - Set the specific percentile to be used as the upper limit; any percentile value can be set.
- Substitution Function (not pictured above) - Only available when 'Substitute Function' is selected for Method (see above). The @RISK distribution function or Excel formula to be used during Stress Analysis.
-
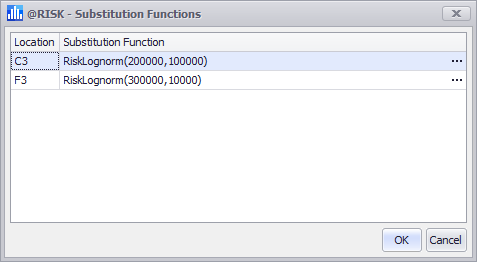
Figure 3 - Substitution Functions Window
When an input group includes more than one input, the Substitute Function option can use a single function to replace all inputs in the group, or individual functions can be assigned to replace specific inputs.
Click the Use Function Wizard button to use Excel’s Function Wizard to enter an alternate distribution that will replace all inputs.
Click the Set Individual Functions button to open the Substitution Functions window (Figure 3, right). Substitute functions can be entered manually, or click the more button (
 ) to the right of each function to open Excel's Function Wizard.