Advanced Sensitivity Analysis
Advanced Sensitivity Analysis allows for the selection of a number of @RISK distributions or worksheet cells in a model, which are then used in trial simulations that vary each of these inputs across a specified range. The Advanced Sensitivity Analysis command of the Simulate menu runs this analysis to determine the degree to which the selected inputs have an effect on an @RISK output. Unlike typical @RISK sensitivity analysis, the inputs analyzed can be either an @RISK distribution or a simple cell reference to a value or formula within an Excel workbook - an analyzed input does not need to contain an @RISK input distribution function. Advanced Sensitivity Analysis runs a full simulation at each of a set of selected values for each input, tracking the overall simulation results at each value. These results then show how simulation results changed as the input values changed.
To run an Advanced Sensitivity Analysis, select Advanced Sensitivity Analysis from the Simulate menu, configure the output and inputs (see below), and click Analyze.
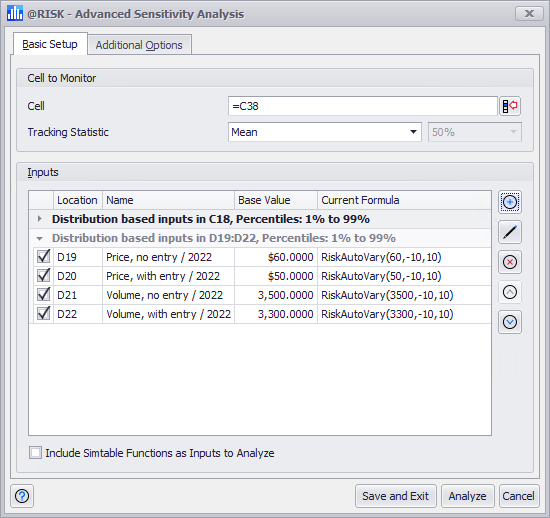
Figure 1 - Advanced Sensitivity Analysis Window
The Advanced Sensitivity Analysis window (Figure 1, right), consists of two tabs - Basic Setup and Additional Options. See Advanced Sensitivity Analysis Options for more information on the configurations available through the Additional Options tab.
The Basic Setup tab contains the following configurations:
- Cell to Monitor - Select a single @RISK output to monitor during simulations, while stepping through possible input values.
- Inputs - The list of inputs that will be included in the simulation; inputs that share the same variation method can be defined together as a group. See below for information on configuring inputs.
-
A single input is still considered to be a group.
To add a group of inputs, click the Add (
 ) button.
To edit or delete an input group, select it in the list and click the Edit (
 ) or Delete (
  ) button.
To reorder input groups, select the group and use the up and down arrows.
-
The order of input groups determines the display order of the inputs in the reports generated by Advanced Sensitivity Analysis.
Please note: only input groups can be reordered. Individual inputs within a group cannot be moved.
- Include Simtable Functions as Inputs to Analyze - Toggle whether or not to include RiskSimtable functions in the analysis. See below for more information.
Including Simtable Functions
If an Advanced Sensitivity Analysis is run on worksheets that include RiskSimtable functions, the Include Simtable Functions as Inputs to Analyze option causes the values specified by these functions to be included in the analysis. If this option is checked, open workbooks will be scanned for RiskSimtable functions. The Advanced Sensitivity Analysis will then step through the values specified in the RiskSimtable function arguments, running a full simulation at each value. The reports generated after the run will show the sensitivity of the output statistic to the variation of the inputs set up in the Advanced Sensitivity Analysis configuration, and to the variation of the values from RiskSimtable functions.
This option is especially useful when an Advanced Sensitivity Analysis is run on an @RISK model that was set up for multiple simulations. @RISK's multiple simulation capability are often used together with RiskSimtable functions to analyze how simulation results change when an input value is changed. This type of simulation and analysis is similar to that performed by an Advanced Sensitivity Analysis. By checking the Include Simtable Functions as Inputs to Analyze option and running an Advanced Sensitivity Analysis, multiple simulation models can get the benefit of all Advanced Sensitivity Analysis reports and graphs with no additional setup, and all within a single analysis execution.
Configuring Inputs
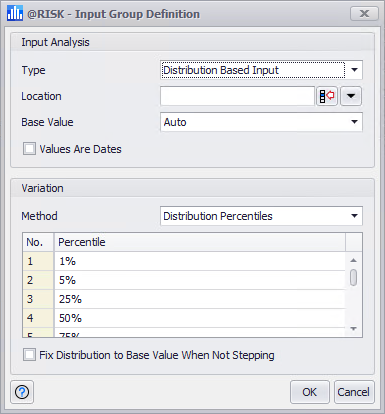
Figure 2 - Input Definition Window - Advanced Sensitivity Analysis
When the Add or Edit buttons (see above) are clicked, the Input Group Definition window (Figure 2, right) will open, allowing for a new input group to be defined or an existing input group to be modified.
Please note: the windows for defining Advanced Sensitivity Analysis inputs refer to groups; but a group can consist of one or more cells!
The Input Group Definition window contains the following configurations:
- Type - Specifies the type of input:
- Location - The cell references for the values or distributions to stress. Multiple inputs can be selected simultaneously if the variation method to be used for those inputs is identical.
-
The location of an input (or inputs) can be a single cell reference, a cell range, multiple non-contiguous cells, or multiple cell ranges.
To specify a single cell or a single range of cells, enter the values manually or use the Select Excel Range button (
 ).
).To specify multiple, non-contiguous cells or multiple cell ranges, open the Range pull-down menu (
 ). From within this menu use the Add button ( ) or Delete button ( ) to add and remove cells or cell ranges, and the move buttons to reorder them.
 - Base Value - This value is used to determine the sequence of values to step through for an input, and as a reference point in the Percent Change report graph. The base value is especially important when utilizing a Variation Method that is a change from base, such as +/- Percent Change from Base.
-
Please note: If a distribution or cell evaluates to 0, and Base Value is set to 'Auto', it is necessary to enter a nonzero base value when using the +/- Percent Change from Base option for variations.
-
By default, the base value is the value a distribution or cell evaluates to when Excel recalculates the worksheet, but you can change it to a different value.
- Values are Dates - Check this box if the inputs are date values.
- Variation - The type of variation @RISK will use to select test values for the input or inputs. See Variation Methods for more information.
- Fix Distribution to Base Value When Not Stepping - The model will keep the base value for a distribution when that distribution is not being stepped through for analysis.
Fix Distribution to Base Value When Not Stepping
When running an Advanced Sensitivity Analysis, it is possible to configure each of the inputs included in the analysis to retain it's base value when stepping through the other inputs, instead of using sampled values. For example, if two inputs are included in an analysis:
Distribution A: =RiskNormal(5,1), with a base value of 5
Distribution B: =RiskUniform(10,20), with a base value of 15
And the inputs use the variation method 'Distribution Percentiles' with three percentile steps (25%, 50%, 75%), a total of 6 simulations will run - 3 for each distribution.
When Distribution A has 'Fix Distribution to Base Value When Not Stepping' checked and Distribution B does not, the following will be seen in each simulation:
Simulations 1, 2, and 3: Distribution A will use the variation method percentiles (e.g. 4.3255 for the 25th percentile) and Distribution B will use values sampled from the uniform distribution per its configuration
Simulations 4, 5, and 6: Distribution A will use a value of 5 for all three simulations (the base value for the distribution) and Distribution B will use the variation method percentiles (e.g. 12.5 for the 25th percentile)
Analyses Names
When working with an Advanced Sensitivity Analysis simulation, the selected inputs are analyzed at various points, or "steps", along their possible values. For each step, a full simulation is run and the results of that simulation are stored. To aid in reporting and analysis, each of the inputs (or a group of inputs if multiple inputs are selected together) can be named.
When running an Advanced Sensitivity Analysis, there are two primary named elements for each simulation run - the Input Name and the Analysis Name.
The Input Name is the name of the stepped input being tested to determine its effect on the output. Input names are determined as follows:
Analysis names relate to the variation method being used on the input. By default, the analysis name uses the variation method and degree of variation as the name, e.g. "Percentile %: 1%" for Distribution Percentile or "Base - 10.00%" for Percent Change from Base.
Certain variation methods can have analysis names manually assigned. The variation methods that can include named analyses are Values from Table and Values from Excel Range.
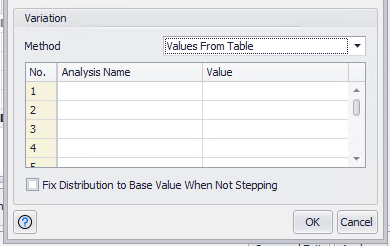
Figure 3 - Analysis Names - Values From Table
The method to add or edit the names for analyses depends on the variation method being used:
-
For Values from Table, enter names in the Analysis Name column of the table (Figure 3, right).
-
For Values from Excel Range, check the 'Define Analysis Names' checkbox and enter or select the range of cells that contain the names in the Range of Names field.