Correlation Graphs
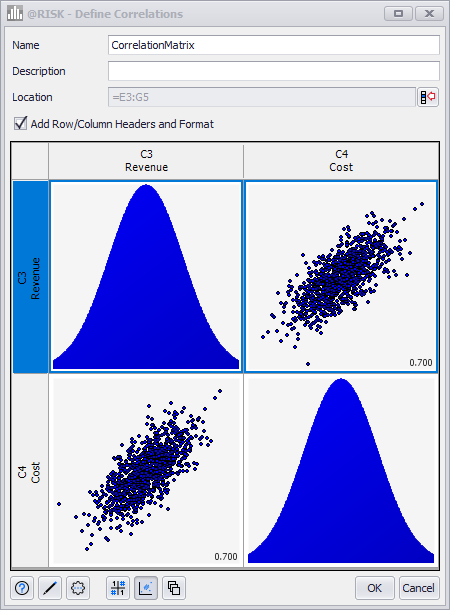
Figure 1 - Define Correlations Graphs
When creating or editing a correlation, the Graphs view of the Define Correlations window (Figure 1, right) provide visualizations of each input (in the form of a probability density graph) and the relationship between two inputs in the form of a scatter plot. These visualizations are included in a matrix using the same organization as the correlation matrix. The scatter plots indicate graphically how the sampled values of any two inputs will be related during a simulation.
The coefficient value for each relationship is displayed in the lower right corner of the scatter plot graph.
Editing Coefficients
For correlations, the coefficients that determine how closely two inputs are related can also be edited from the Graphs view.
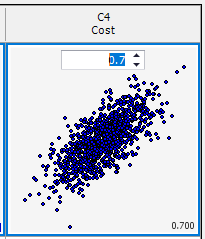
Figure 2 - Edit Coefficient
To edit a coefficient within the Graph view, double-click the graph of the coefficient to be modified. A field displaying the current coefficient value will appear (Figure 2, right); enter a new coefficient value or use the arrow keys to modify the value. Click outside the field to accept the new value.