Fit Ranking Methods
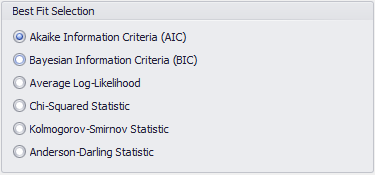
Figure 1 - Best Fit Selection
The fitting process generates goodness-of-fit statistics for each distribution tested, using several different methods for ranking how well a distribution (and its estimated parameters) fits to the selected data set. The Best Fit Selection configuration (Figure 1, right) determines which ranking method will initial display in the Fit Results, but the statistics for all methods are generated during the fitting process.
Please note: Three ranking tests for Goodness-of-Fit are available for fitting in @RISK Essential:
- Chi-square
- Komolgorov-Smirnov
- Anderson-Darling
Three additional ranking tests are available for fitting in @RISK Business with the Enhanced Distribution Pack and @RISK Enterprise:
- Akaike Information Criteria
- Bayesian Information Criteria
- Average Log-likelihood
The ranking methods available in @RISK:
The distinction between the ranking methods is very complex, and detailed discussion of the methods, and distinctions between, each of these methods is beyond the scope of this document. It is generally recommended that the AIC or BIC methods be used for ranking unless the results of the other methods is well understood.
Ranking Methods in Fit Results
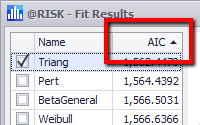
Figure 2 - Fit Results Ranking
The ranking used by @RISK to recommend the Best Fit distribution is initially selected in the Results tab of the Fit Distributions to Data window; however, the ranking method can be changed after the fitting process has run. The ranking method currently active in the Fit Results window will be displayed in the column header of the distribution list (Figure 2, right).
Clicking the header of any column will toggle between ordering the list by ascending or descending values.
Each of the ranking methods is based on a different fit statistic. There are two things to note, however, about these statistics. First, they are not linear; a value that is twice as high does not imply a fit that is twice as bad. Second, and most importantly, is that with one exception, the lower the ranking value, the better the fit. The exception to this is Average Log-Likelihood, where higher is better.