Trend Tab
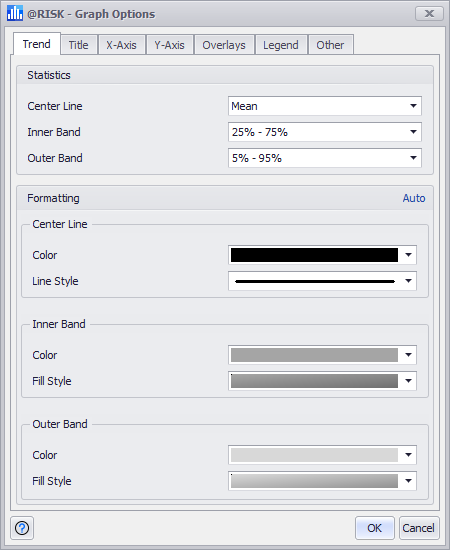
Figure 1 - Graph Options Trend Tab
The Trend tab contains options for configuring how summary trend graphs are displayed. See Summary Trend Graphs for more information on this graph type.
The Statistics group defines which statistics will be used to determine the center line (either the mean, median, or mode) as well as the boundaries of the inner and outer band of the trend graph.
The colors and styling used to display the trend graph can be changed in the Formatting group. Unclick the Auto button in the upper right corner to override the default options.