Scatter Tab
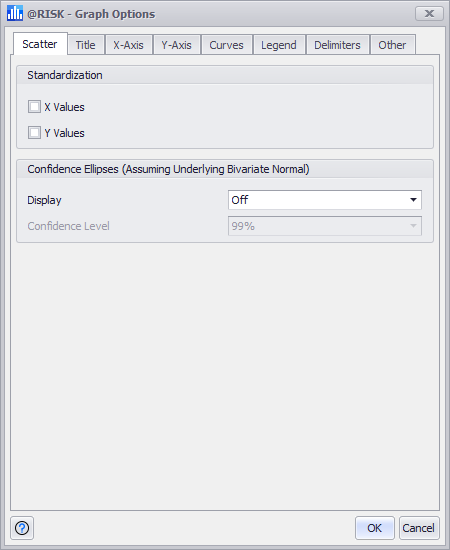
Figure 1 - Graph Options Scatter Tab
The Scatter tab contains options that are specific to scatter plot graphs. See Scatter Plot Graphs for more information about this graph type.
In some cases it is convenient to “standardize” the data shown in a scatter graph. The Standardization group has options for converting the raw data into the number of standard deviations away from the mean - optionally for either or both the x- or y- dimension. Standardization is especially useful when overlaying scatter plots from different input distributions. This allows a common scale between the inputs making comparisons easier.
The Confidence Ellipses group contains options for displaying confidence ellipse around the data. A confidence ellipse assumes bivariate normality for the data, and will display an ellipse that is expected to contain the percentage of values set in the Confidence Level option.