Markers Tab

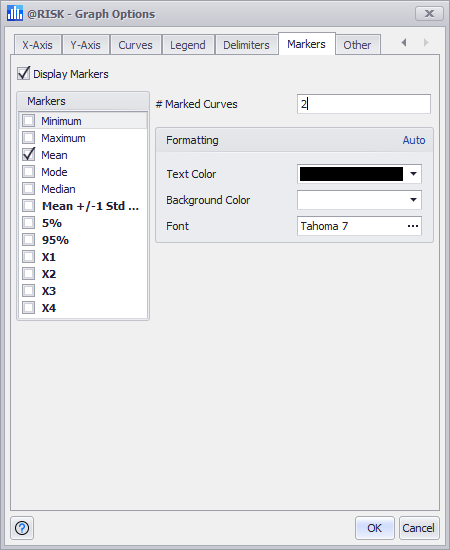
Figure 1 - Graph Options Markers Tab

The Markers Tab (Figure 1, right) provides options that control how specific markers are displayed on distribution graphs. Markers annotate key values on a graph. See Distribution Markers for more information.

The options available are: 

  • Display Markers - Toggle to enable markers on the graph.
  • Markers - This option group contains a list of markers from which to choose.
  • Some markers have associated configuration options. Click the Edit button that appears to the right of a marker name (after it is selected) to display its options.

  • # Marked Curves - Determines the maximum number of curves for which to display markers. Often this is set to 1, indicating that no overlay curves will have markers displayed.
  • Formatting - The color and fonts used to display the titles can be changed in this group. Unclick the Auto button in the upper right corner to override the default formatting options.