Box-Whisker Tab
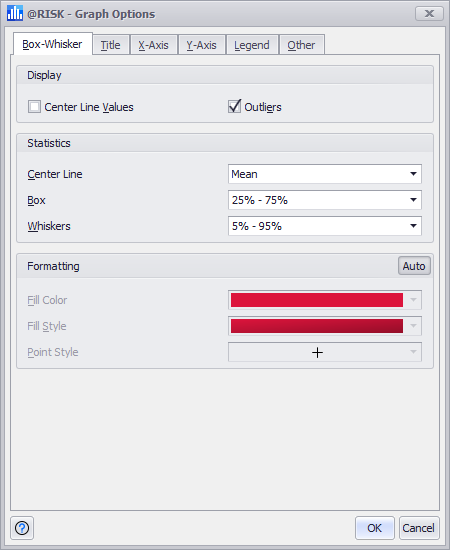
Figure 1 - Graph Options Box-Whisker Tab
The Box-Whisker tab contains options for configuring how box plot graphs are displayed. See Summary Box Plot Graphs for more information on this graph type.
The Display group controls the display of visual elements included in the graph. Center Line Values controls whether or not the value of the center line for each box will be displayed on the graph, and Outliers controls the display of outlier data points.
The Statistics group defines what statistics will be used to determine the center line (either the mean, median, or mode) as well as the boundaries of the box and whisker in terms of percentiles.
The Formatting section configures the color and styling of the boxes and the outlier data points (if they are displayed). Unclick the Auto button in the upper right corner to override the formatting options.
Fill Color and Fill Style determine the color and pattern of the box components; Point Style controls the shape of the outlier data points. Outliers use the Fill Color value.