Distribution Graph Legends
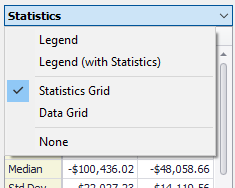
Figure 1 - Graph Legend Menu
Distribution graphs can be displayed with a number of different types of legends, or no legend at all. This is controlled by the legend selector at the top right of the graph (Figure 1, right).
The types of legends are:
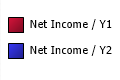
Legend - A simple legend showing the name of each distribution being graphed next to a graphical indicator for its color and format.
Legend (with Statistics) – A more sophisticated legend with additional statistics.

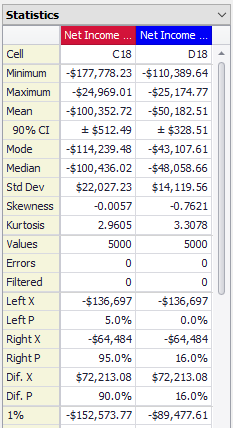
Statistics Grid – A table that includes a wide array of summary statistics and percentiles. Legend information is shown at the top of the table and each distribution in the graph is shown in a single column.
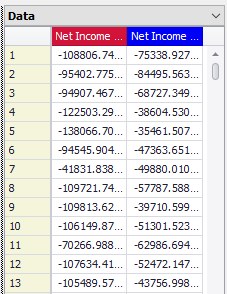
Data Grid – For simulation graphs only. A table that includes all the simulated data values. Legend information is shown at the top of the table and each distribution in the graph is shown in a single column.
None – No legend will be displayed.