RiskHistogrm
|
Description |
RiskHistogrm(minimum, maximum, {p1,p2,...,pn}) specifies a user-defined histogram distribution with a range defined by the specified minimum and maximum values. This range is divided into n classes. Each class has a weight p reflecting the probability of occurrence of a value within the class. These weights can be any nonnegative values to indicate relative likelihoods, but @RISK will normalize them so that they sum to 1.
|
|
Examples |
RiskHistogrm(10,20,{1,2,3,2,1}) returns a histogram distribution with minimum value 10 and a maximum value 20. This range is divided into 5 equal-length classes because there are 5 probability weights, 1, 2, 3, 2 and 1. The normalized probabilities would be 1/9, 2/9, 3/9, 2/9, and 1/9. RiskHistogrm(A1,A2,B1:B3) returns a histogram distribution with minimum and maximum values taken from cells A1 and A2. This range is divided into 3 equal-length classes because there are 3 probability weights, taken from cells B1 through B3.
|
|
Guidelines |
All p values must be nonnegative. |
|
Parameters |
min continuous parameter min < max * max continuous parameter {p} = {p1, p2, ..., pN} array of continuous parameters,
*min = max is supported for modelling convenience, but yields degenerate distribution.
|
|
Domain |
|
|
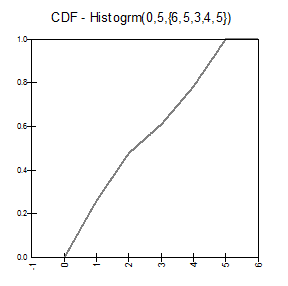
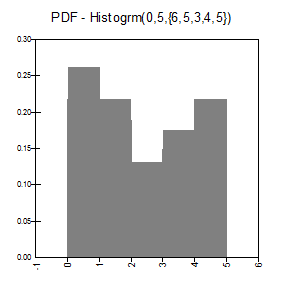
Density and Cumulative Distribution Functions |
Here, the {p} array has been normalized so that the area under the histogram is 1. |
|
Mean |
No Closed Form
|
|
Variance |
No Closed Form
|
|
Skewness |
No Closed Form
|
|
Kurtosis |
No Closed Form
|
|
Mode |
Not Uniquely Defined.
|
|
Examples |
|

 continuous
 for
for 
 for
for 
 continuous