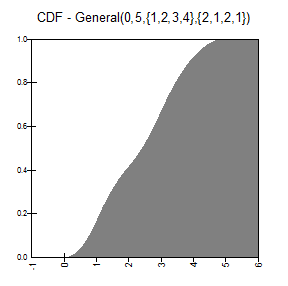
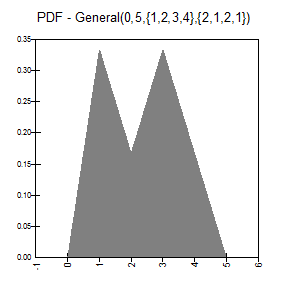
RiskGeneral
|
Description |
RiskGeneral(minimum,maximum,{X1,X2,...,Xn},{p1,p2,...,pn}) specifies a generalized probability distribution defined by a density curve specified at n points. Each point has a value X and a probability weight p that specifies the relative height of the density curve at that X value. The probability weights can sum to any value, but internally, @RISK normalizes them so that they sum to 1.
|
|
Examples |
RiskGeneral(0,10,{2,5,7,9},{1,2,3,1}) returns a general probability distribution density function with four points. The distribution ranges from 0 to 10 with the height of the curve specified at the values 2, 5, 7, and 9. The relative heights of the curve at these values are 1, 2, 3, and 1. The curve intersects the X-axis at 0 and 10. RiskGeneral(100,200,A1:C1,A2:C2) returns a general probability distribution with three data points and a range of 100 to 200. Cells A1 through C1 hold the X values, and cells A2 through C2 hold the p values. Note that curly braces are not required when cell ranges are used as array entries to the function.
|
|
Guidelines |
The p values must be nonnegative. The X values must be entered in increasing order and must fall within the minimum-maximum range of the distribution. minimum must be less than maximum. |
|
Parameters |
min continuous parameter min < max max continuous parameter {x} = {x1, x2, ..., xN} array of continuous parameters {p} = {p1, p2, ..., pN} array of continuous parameters
|
|
Domain |
|
|
Density and Cumulative Distribution Functions |
for
The p and X arrays are assumed to be ordered from left to right. The p array is normalized so that the area under the density curve is 1. The i index runs from 0 to N+1, with two extra elements :
|
|
Mean |
No Closed Form
|
|
Variance |
No Closed Form |
|
Skewness |
No Closed Form
|
|
Kurtosis |
No Closed Form
|
|
Mode |
No Closed Form |
|
Examples |
|

